First Spike Train Analysis
By the end of this tutorial, you will learn the basic analysis workflow in NeuroExplorer. This includes opening a data file, selecting an analysis, running the analysis, viewing numerical results, and saving the results.
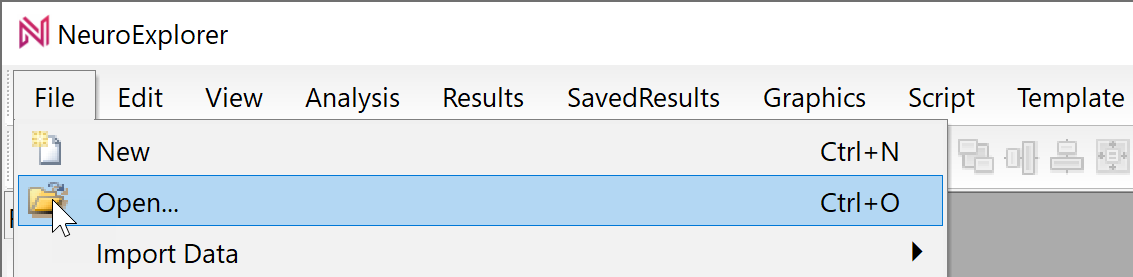
Select File | Open menu command:
Select TestDataFile5.nex file and click OK in the Open dialog. NeuroExplorer will load the test data file:
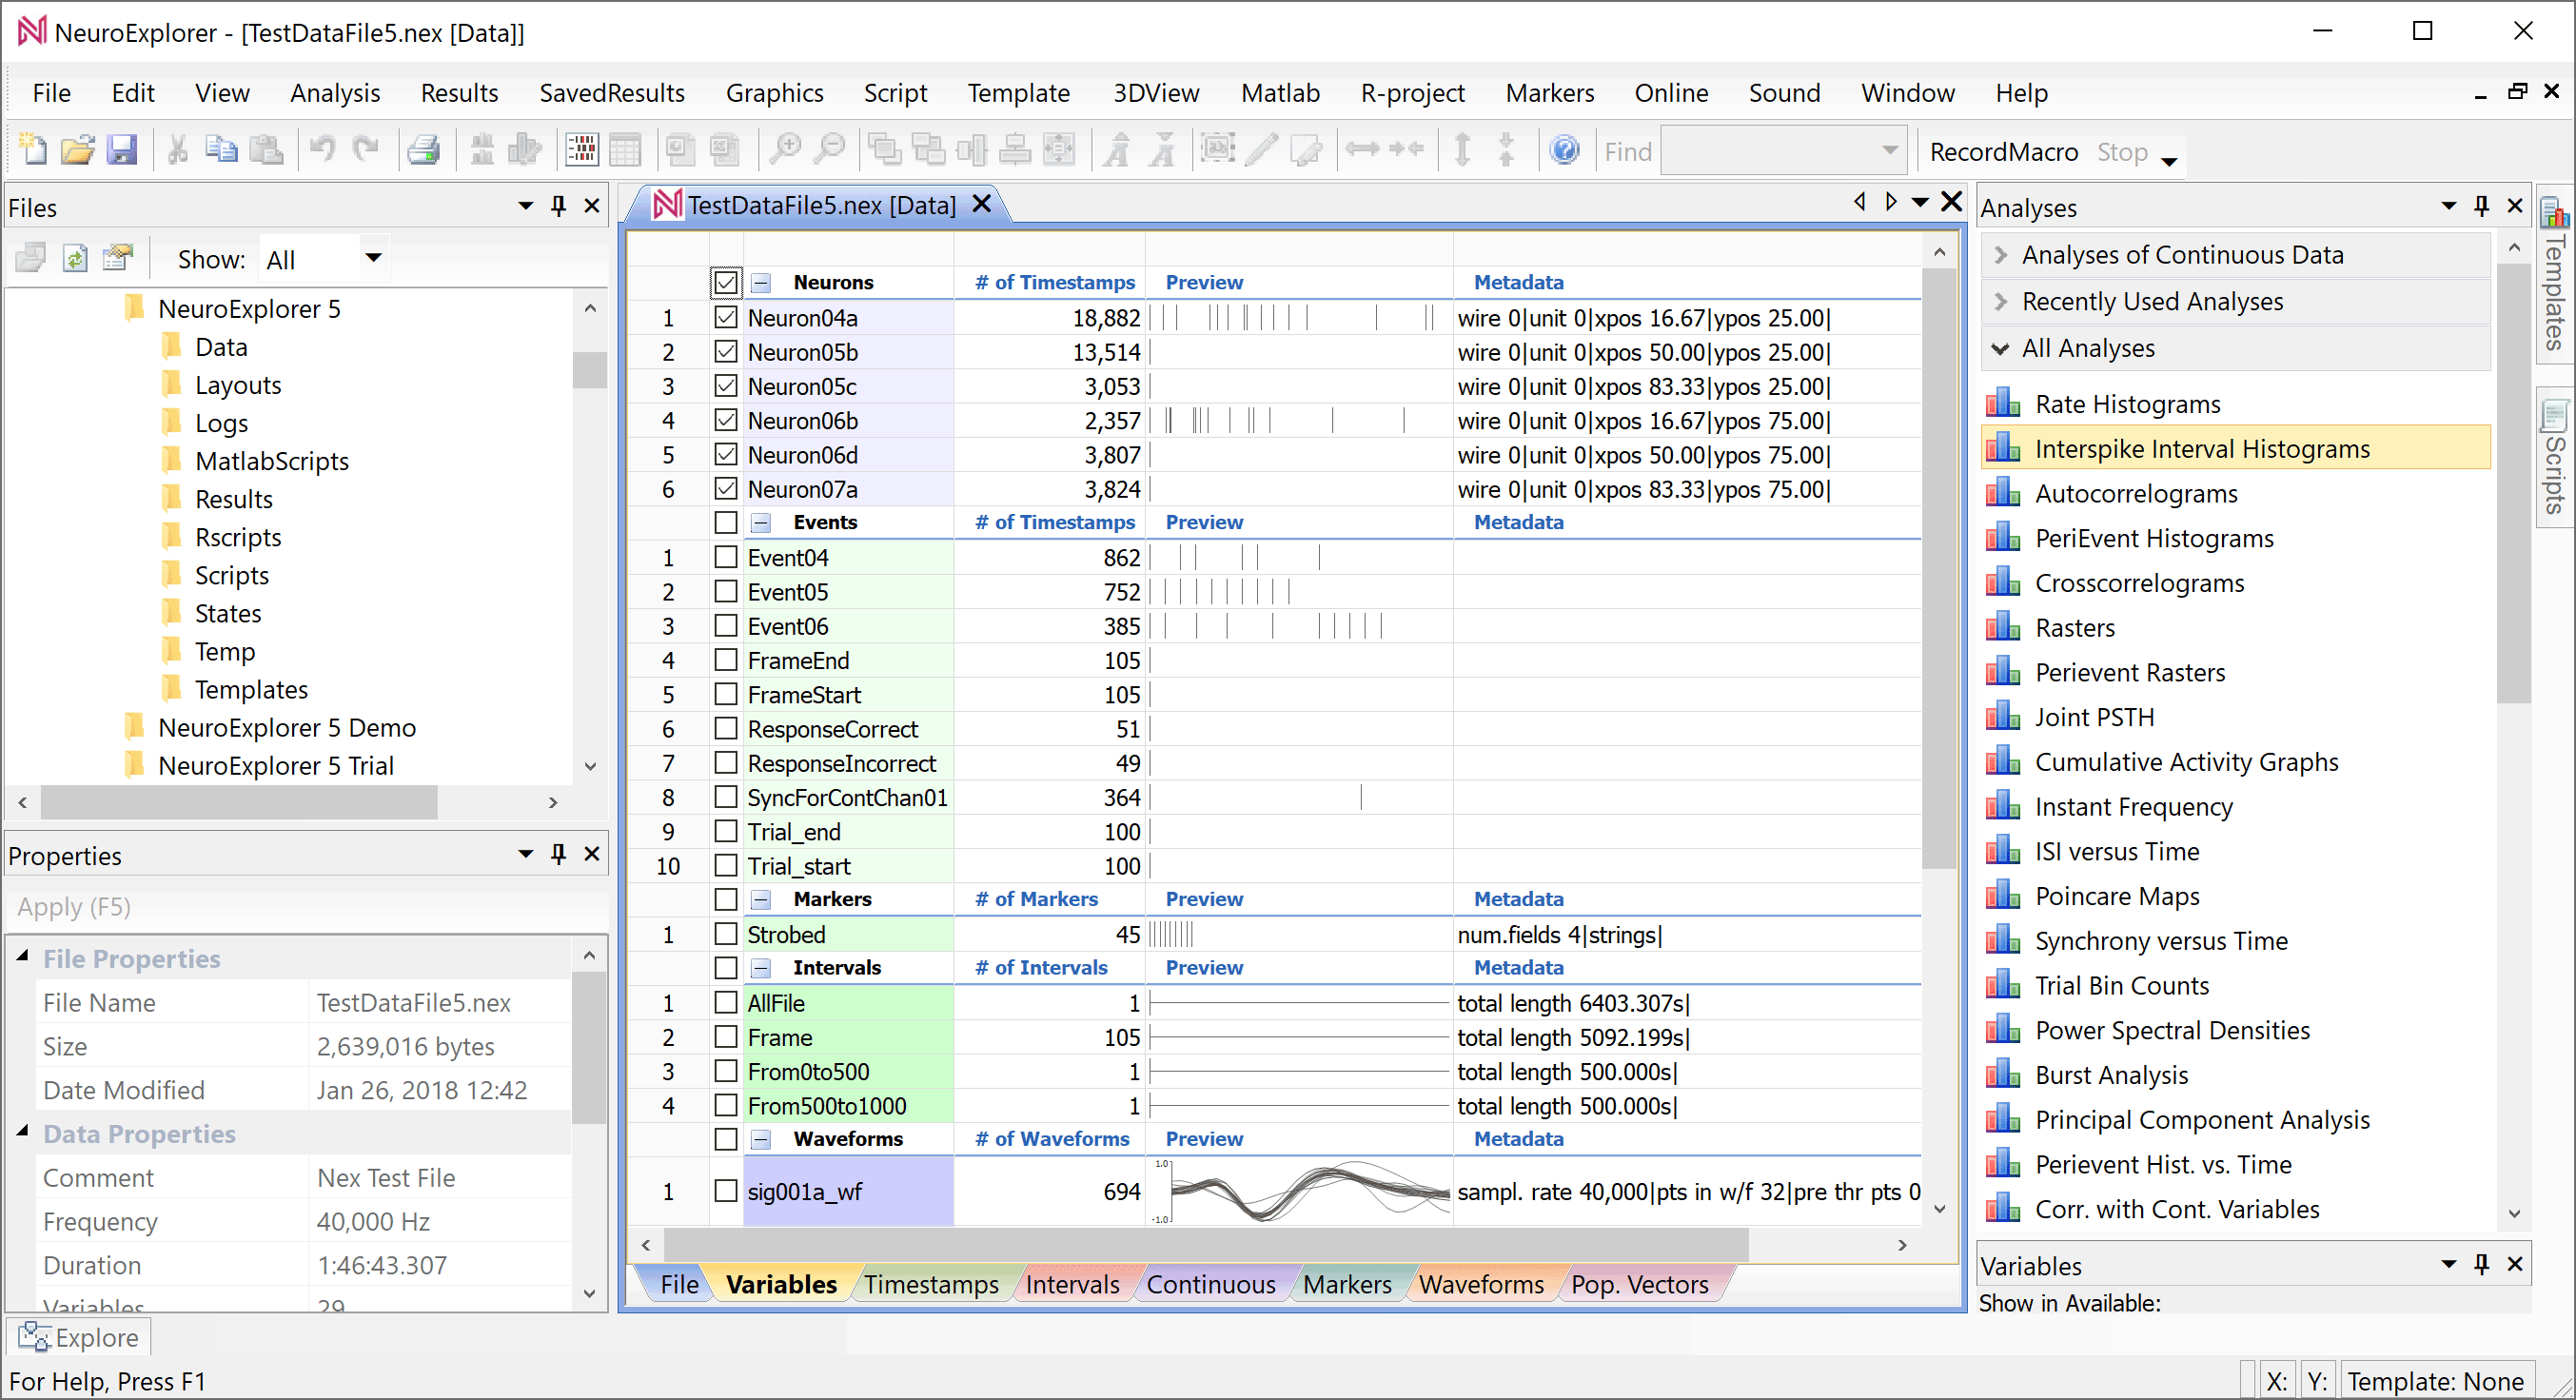
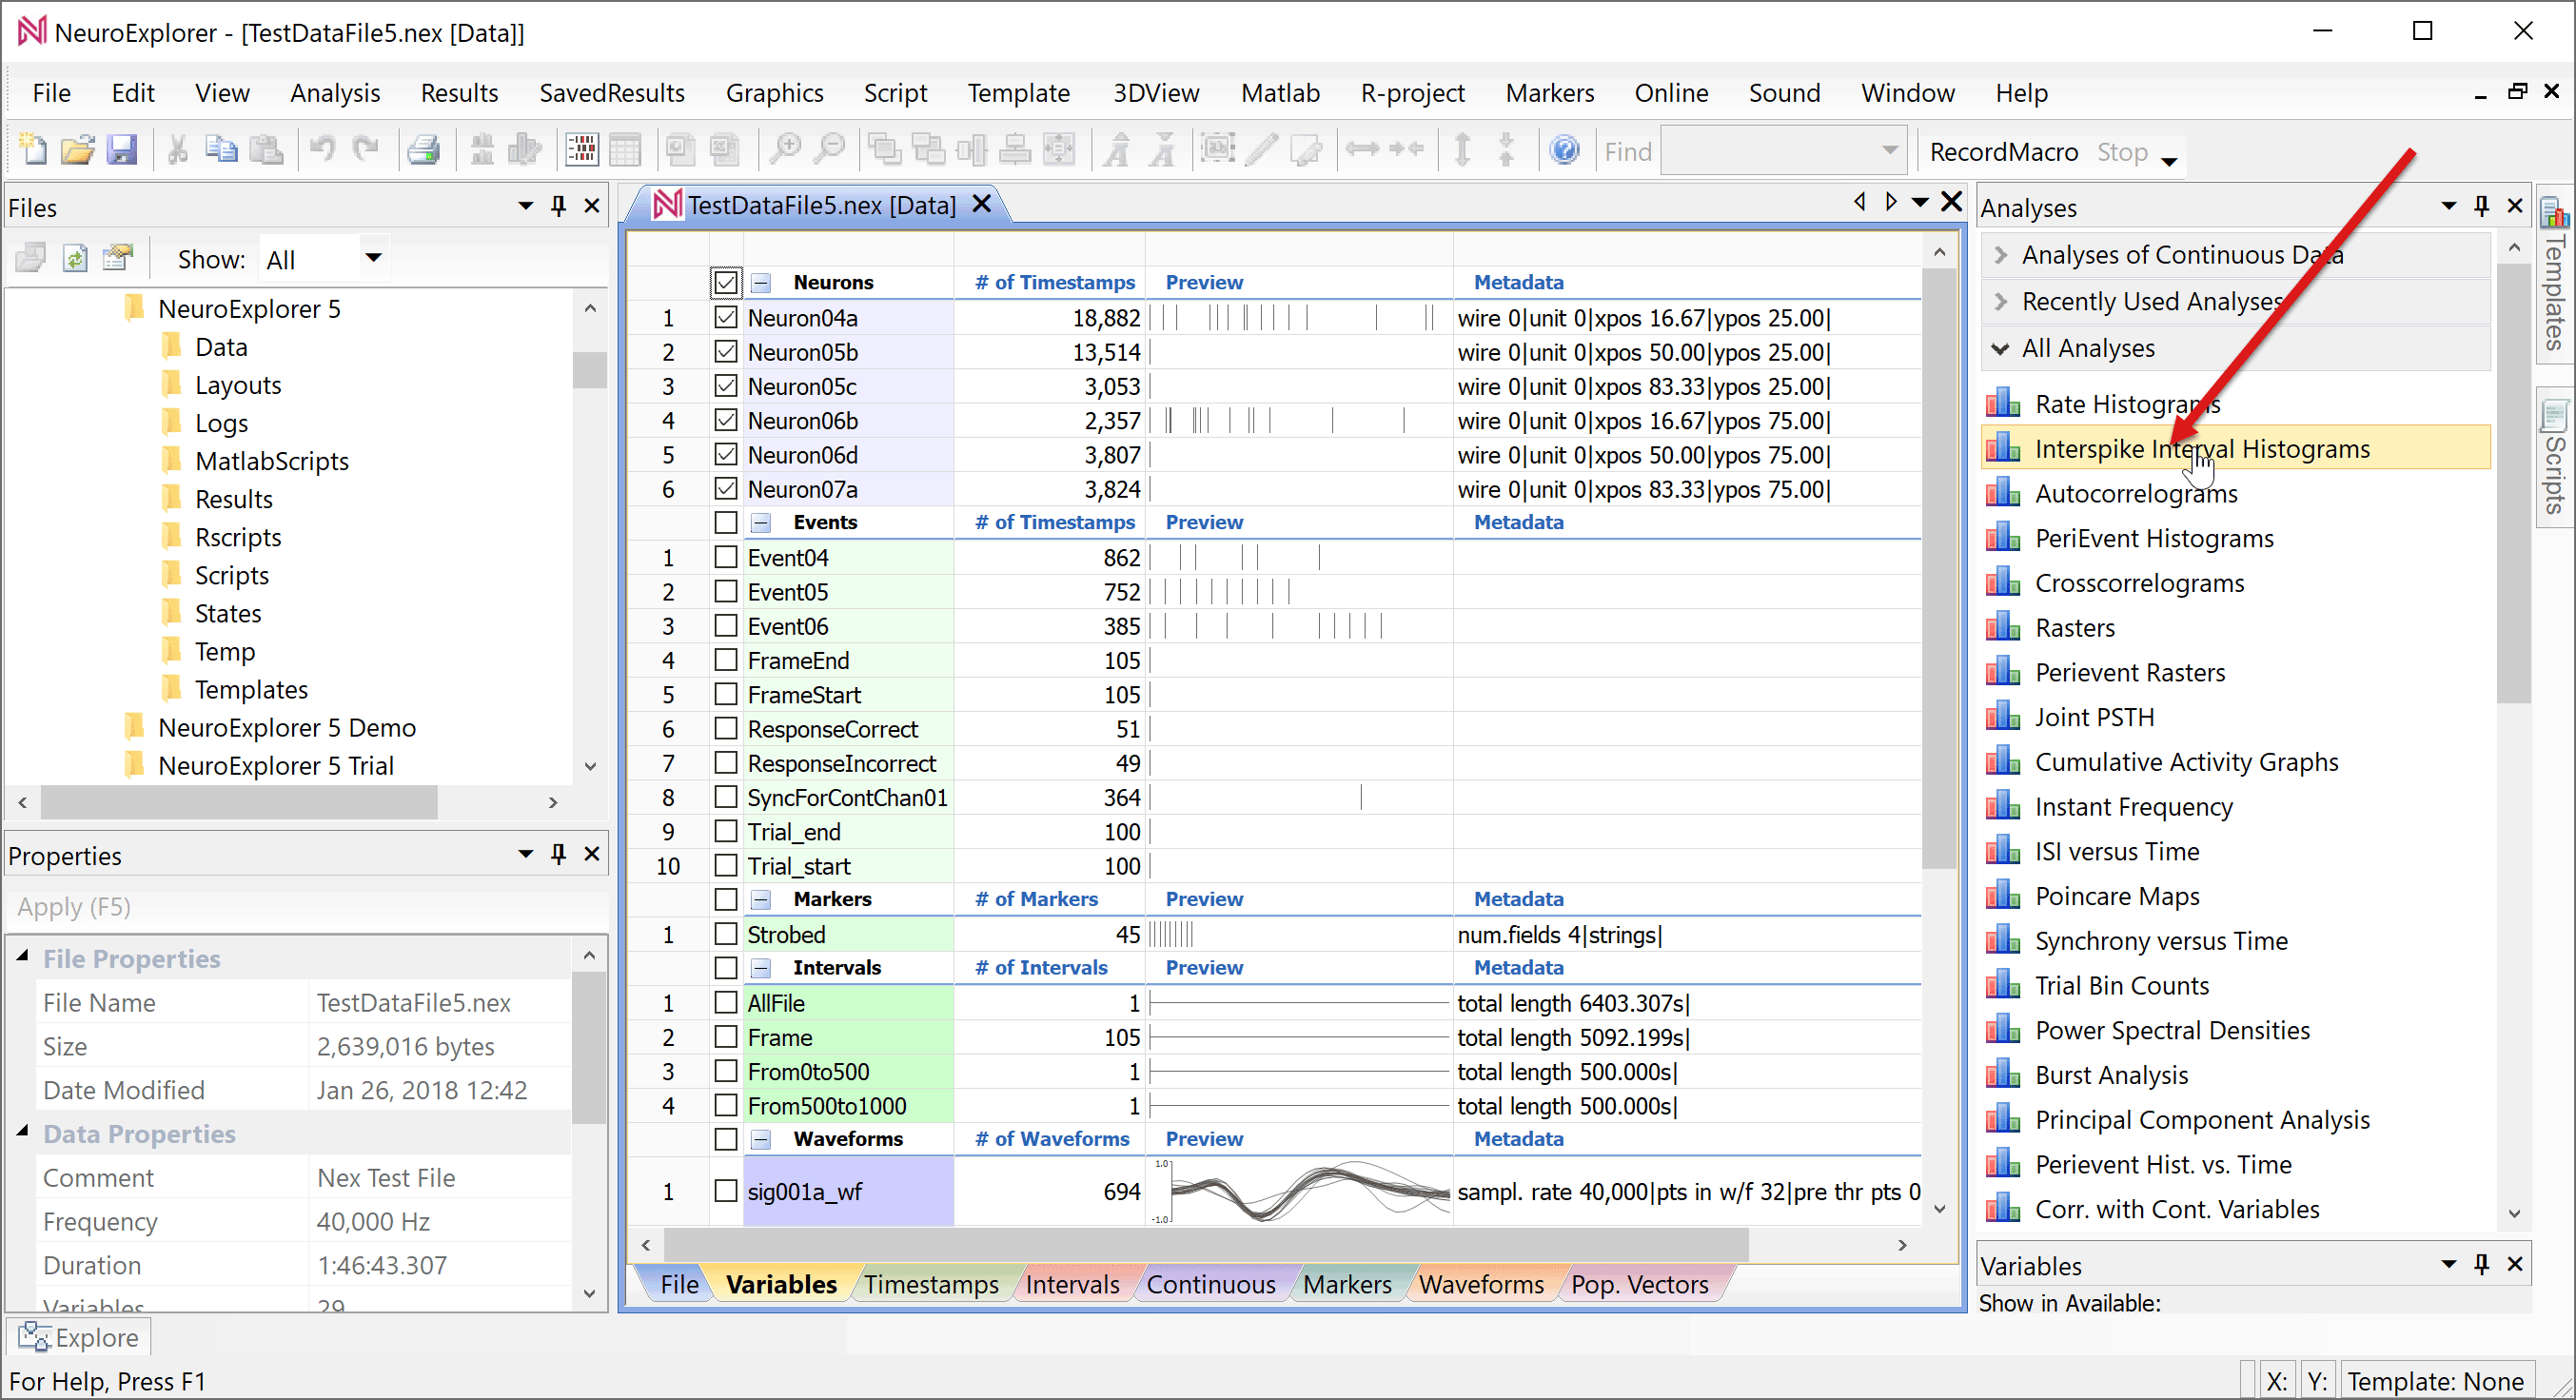
Select analysis type by clicking the Interspike Interval Histograms line in the Analyses panel:
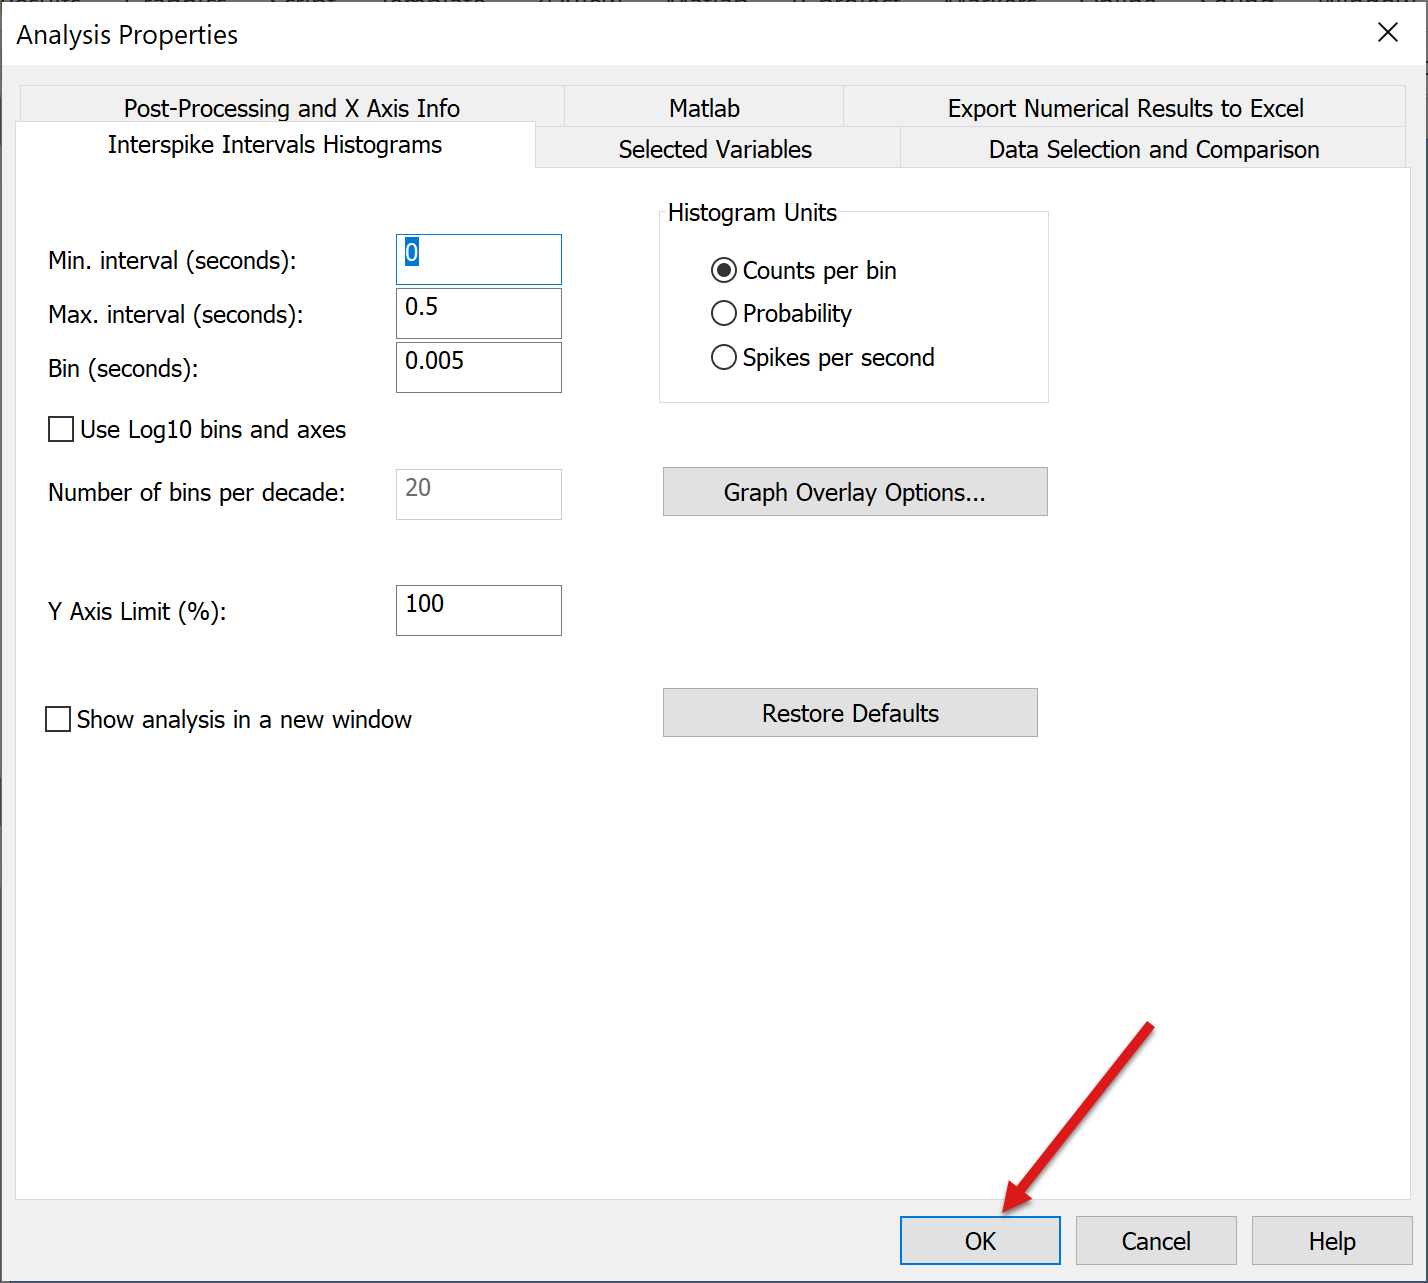
NeuroExplorer will open Analysis Properties dialog. Click OK in the dialog:
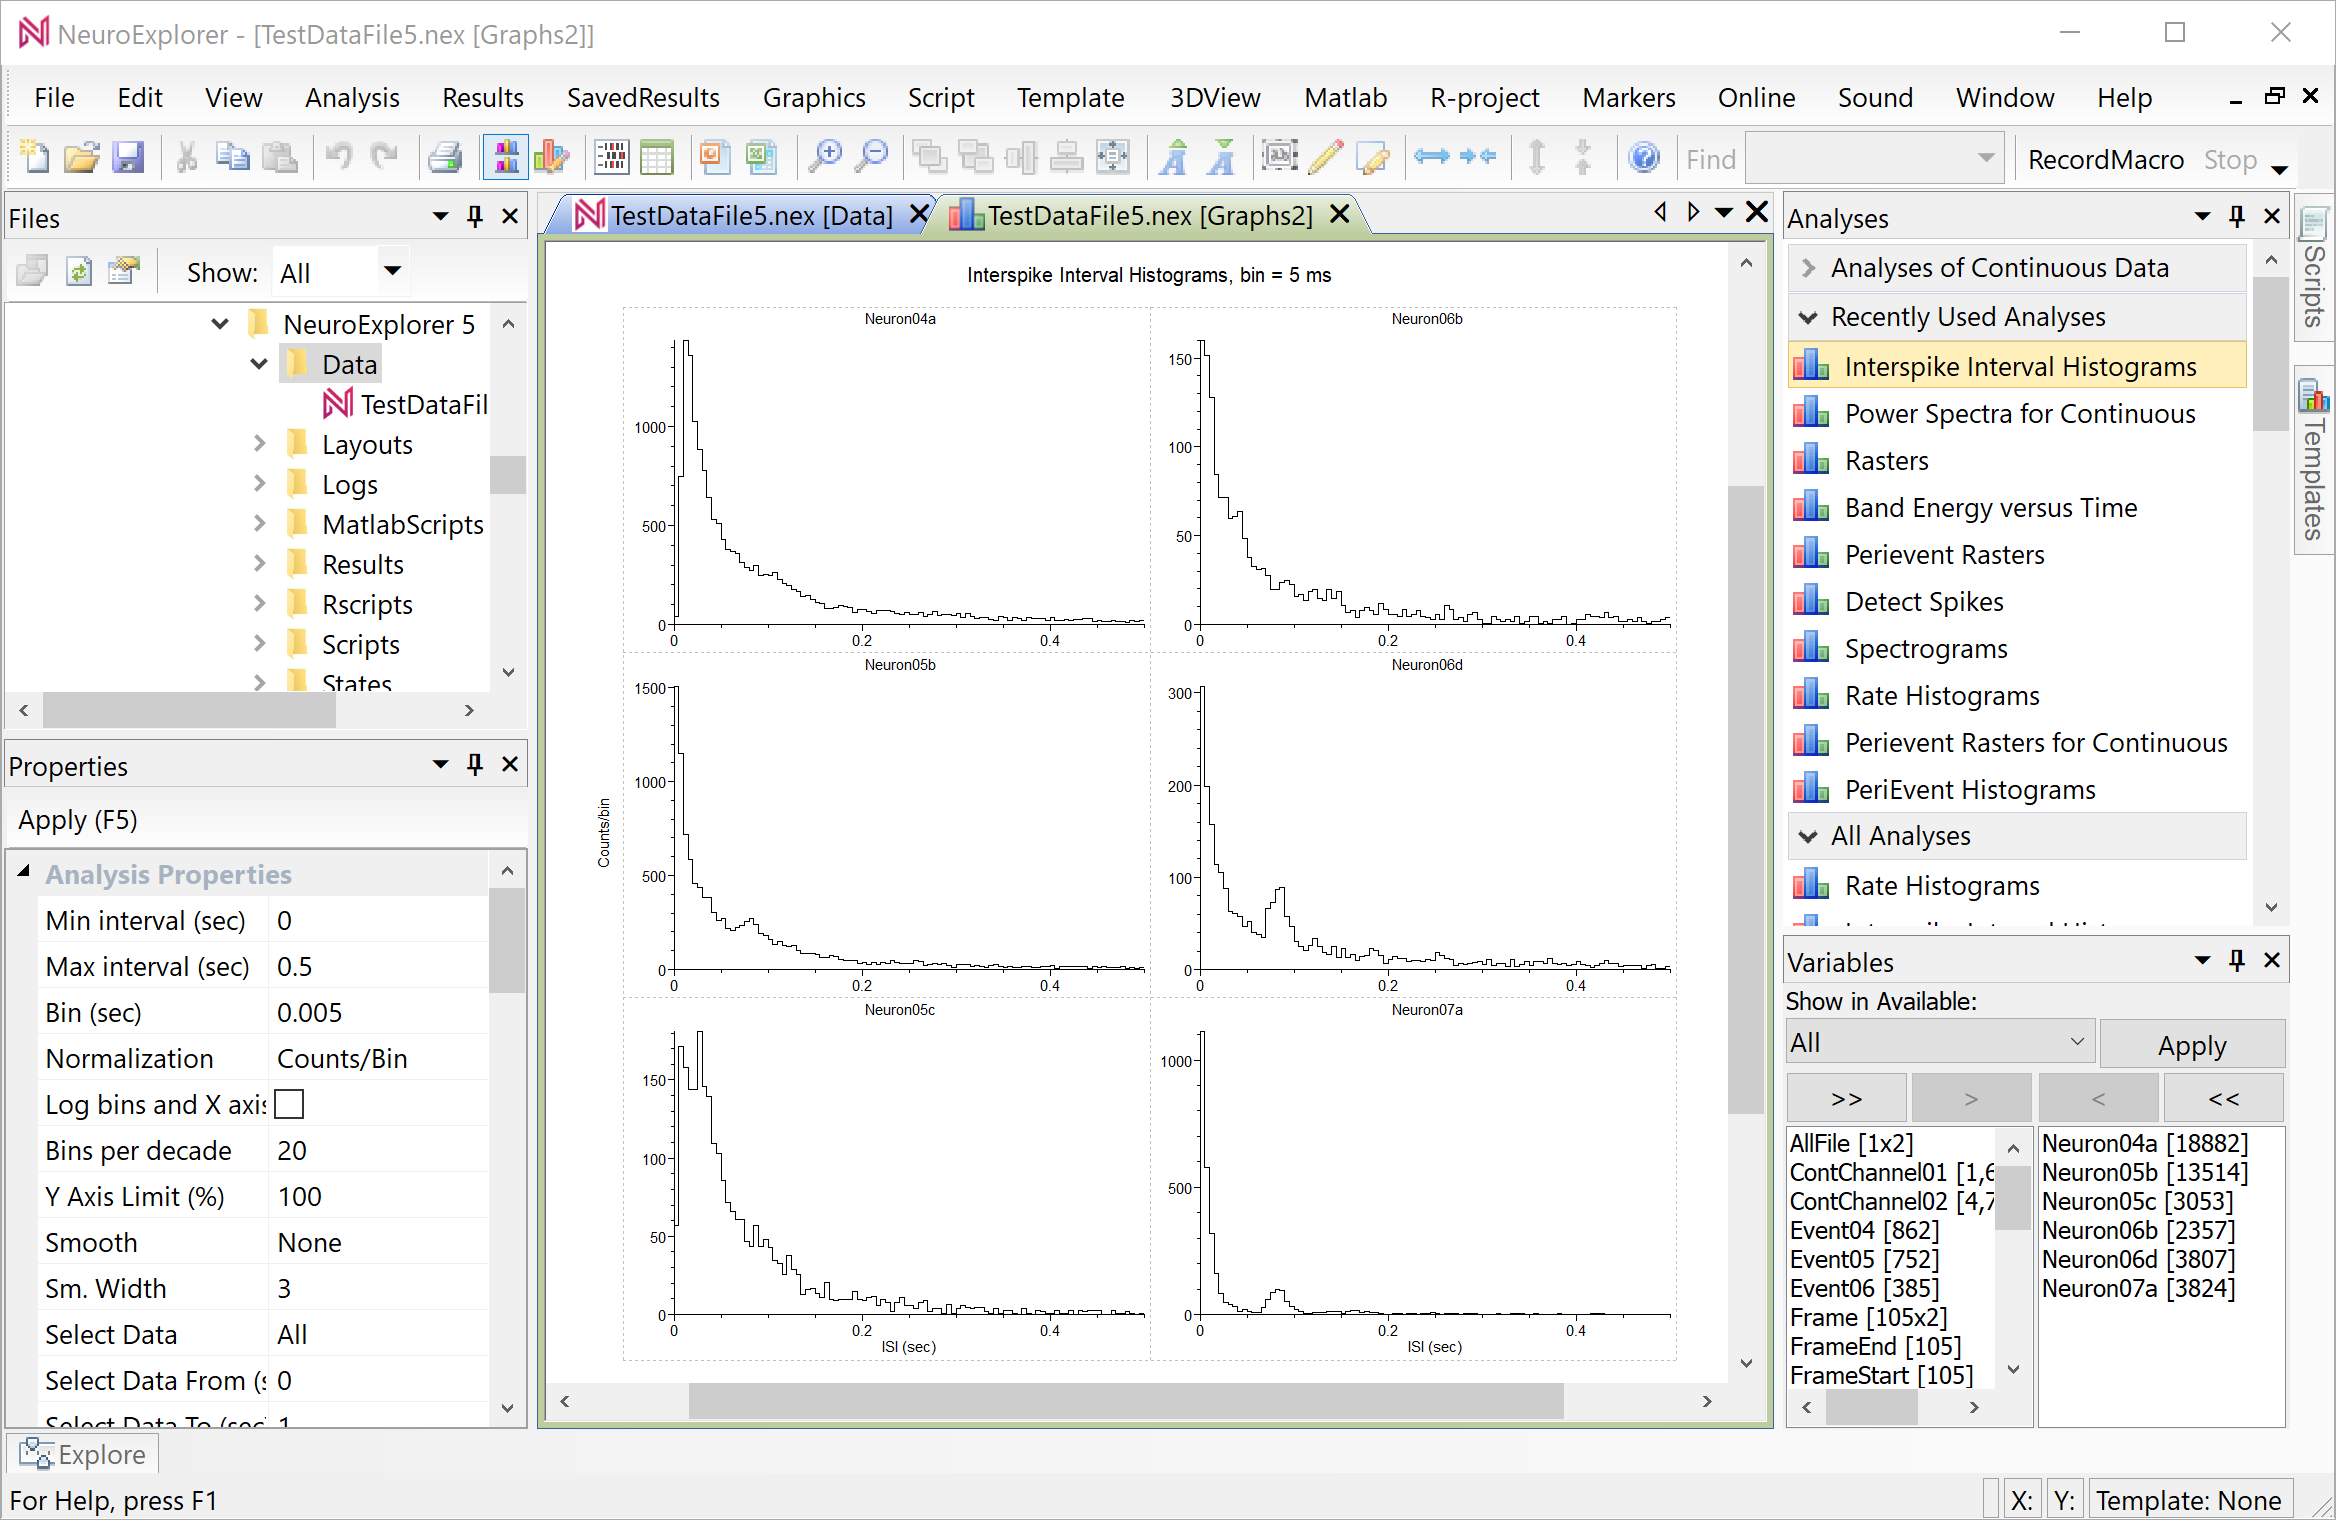
NeuroExplorer will open a new window with graphical analysis results:
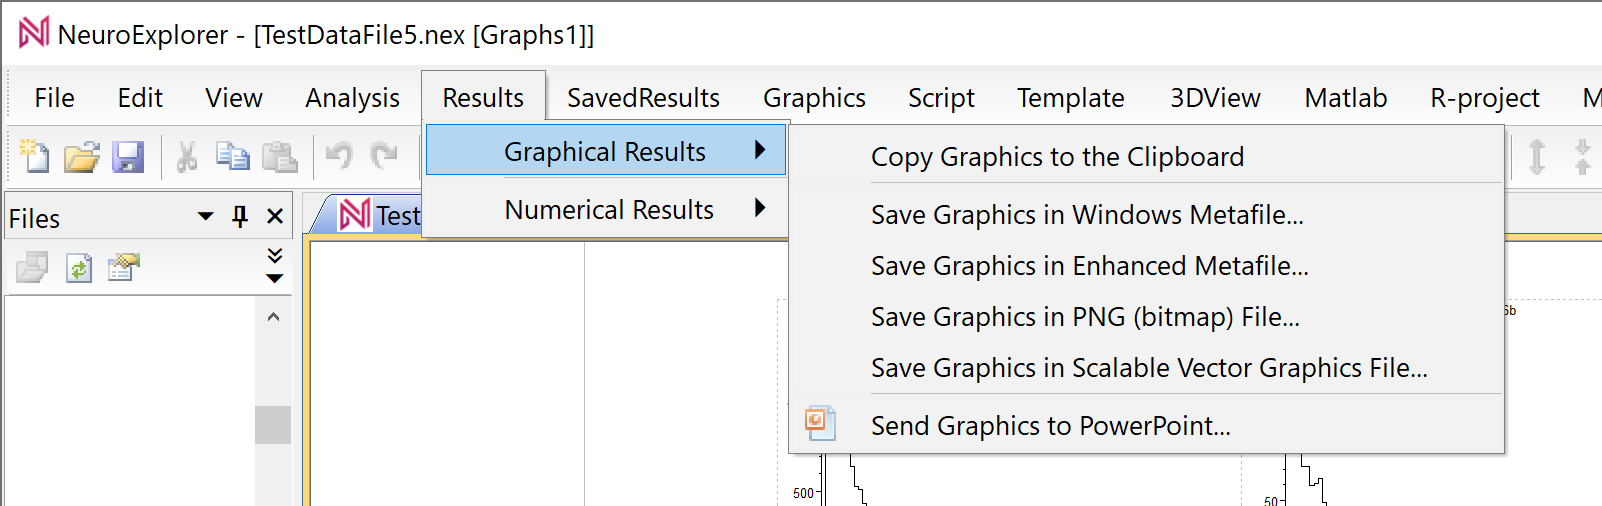
You can save graphical analysis results using Results | Graphical Results menu commands:
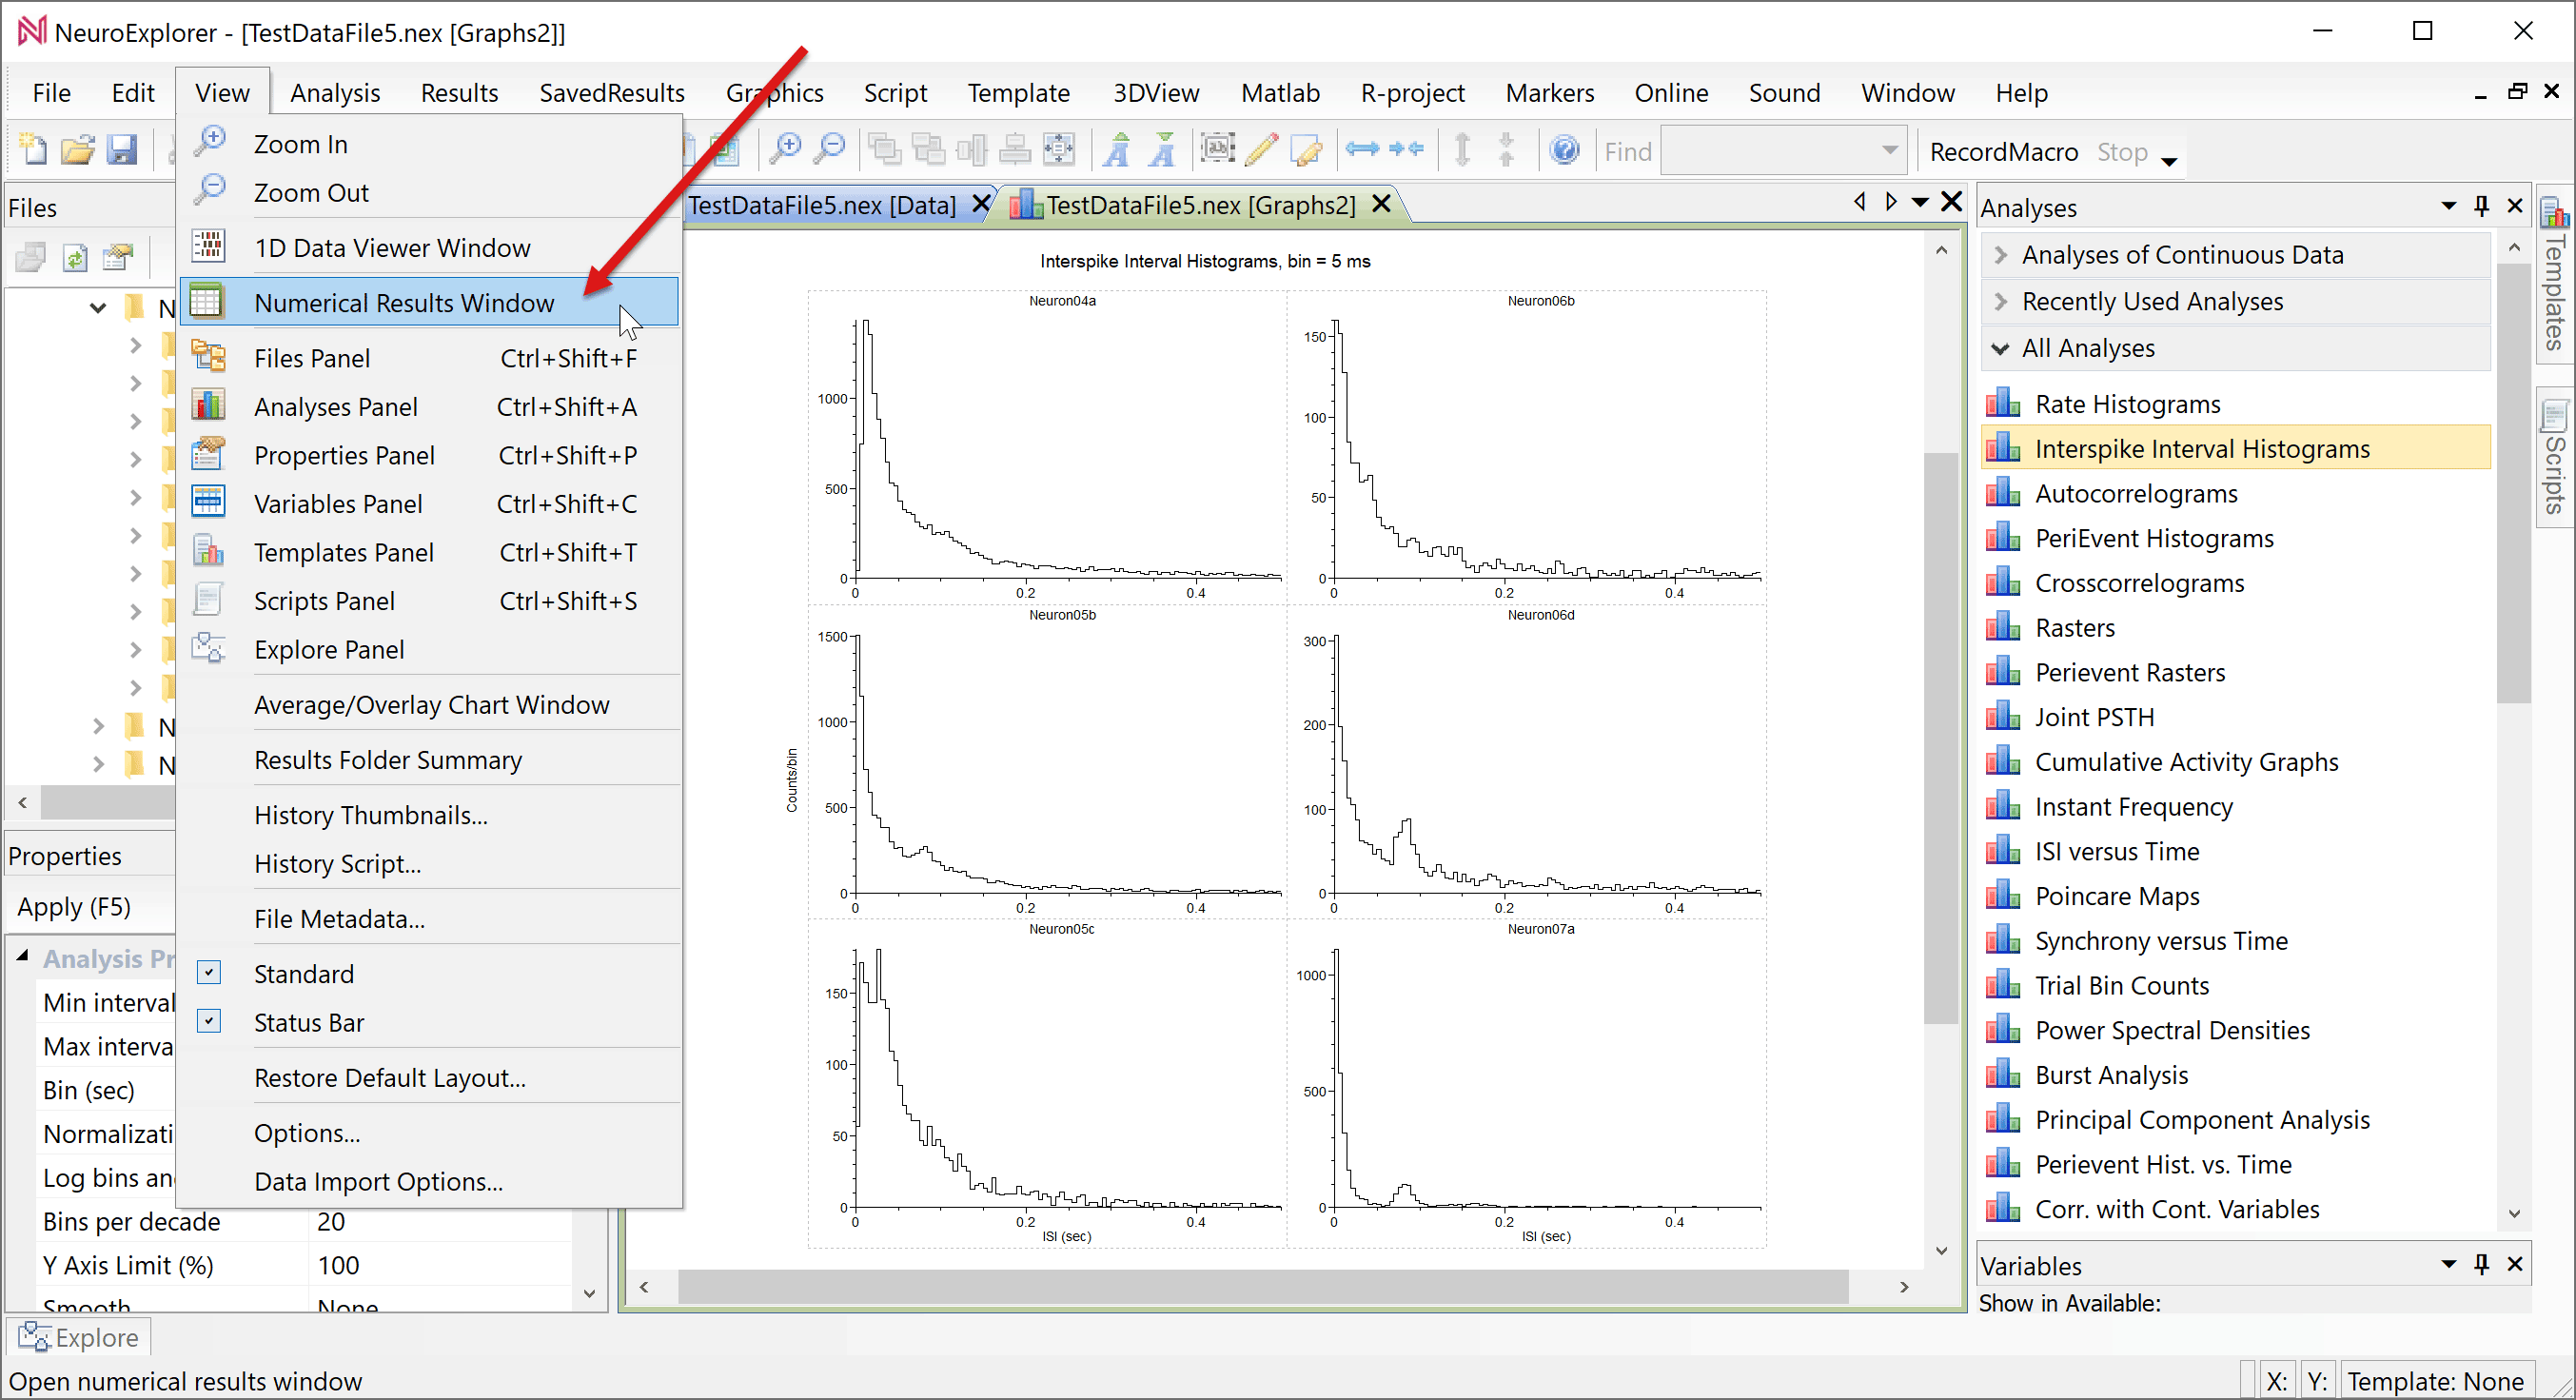
Select View | Numerical Results Window menu command:
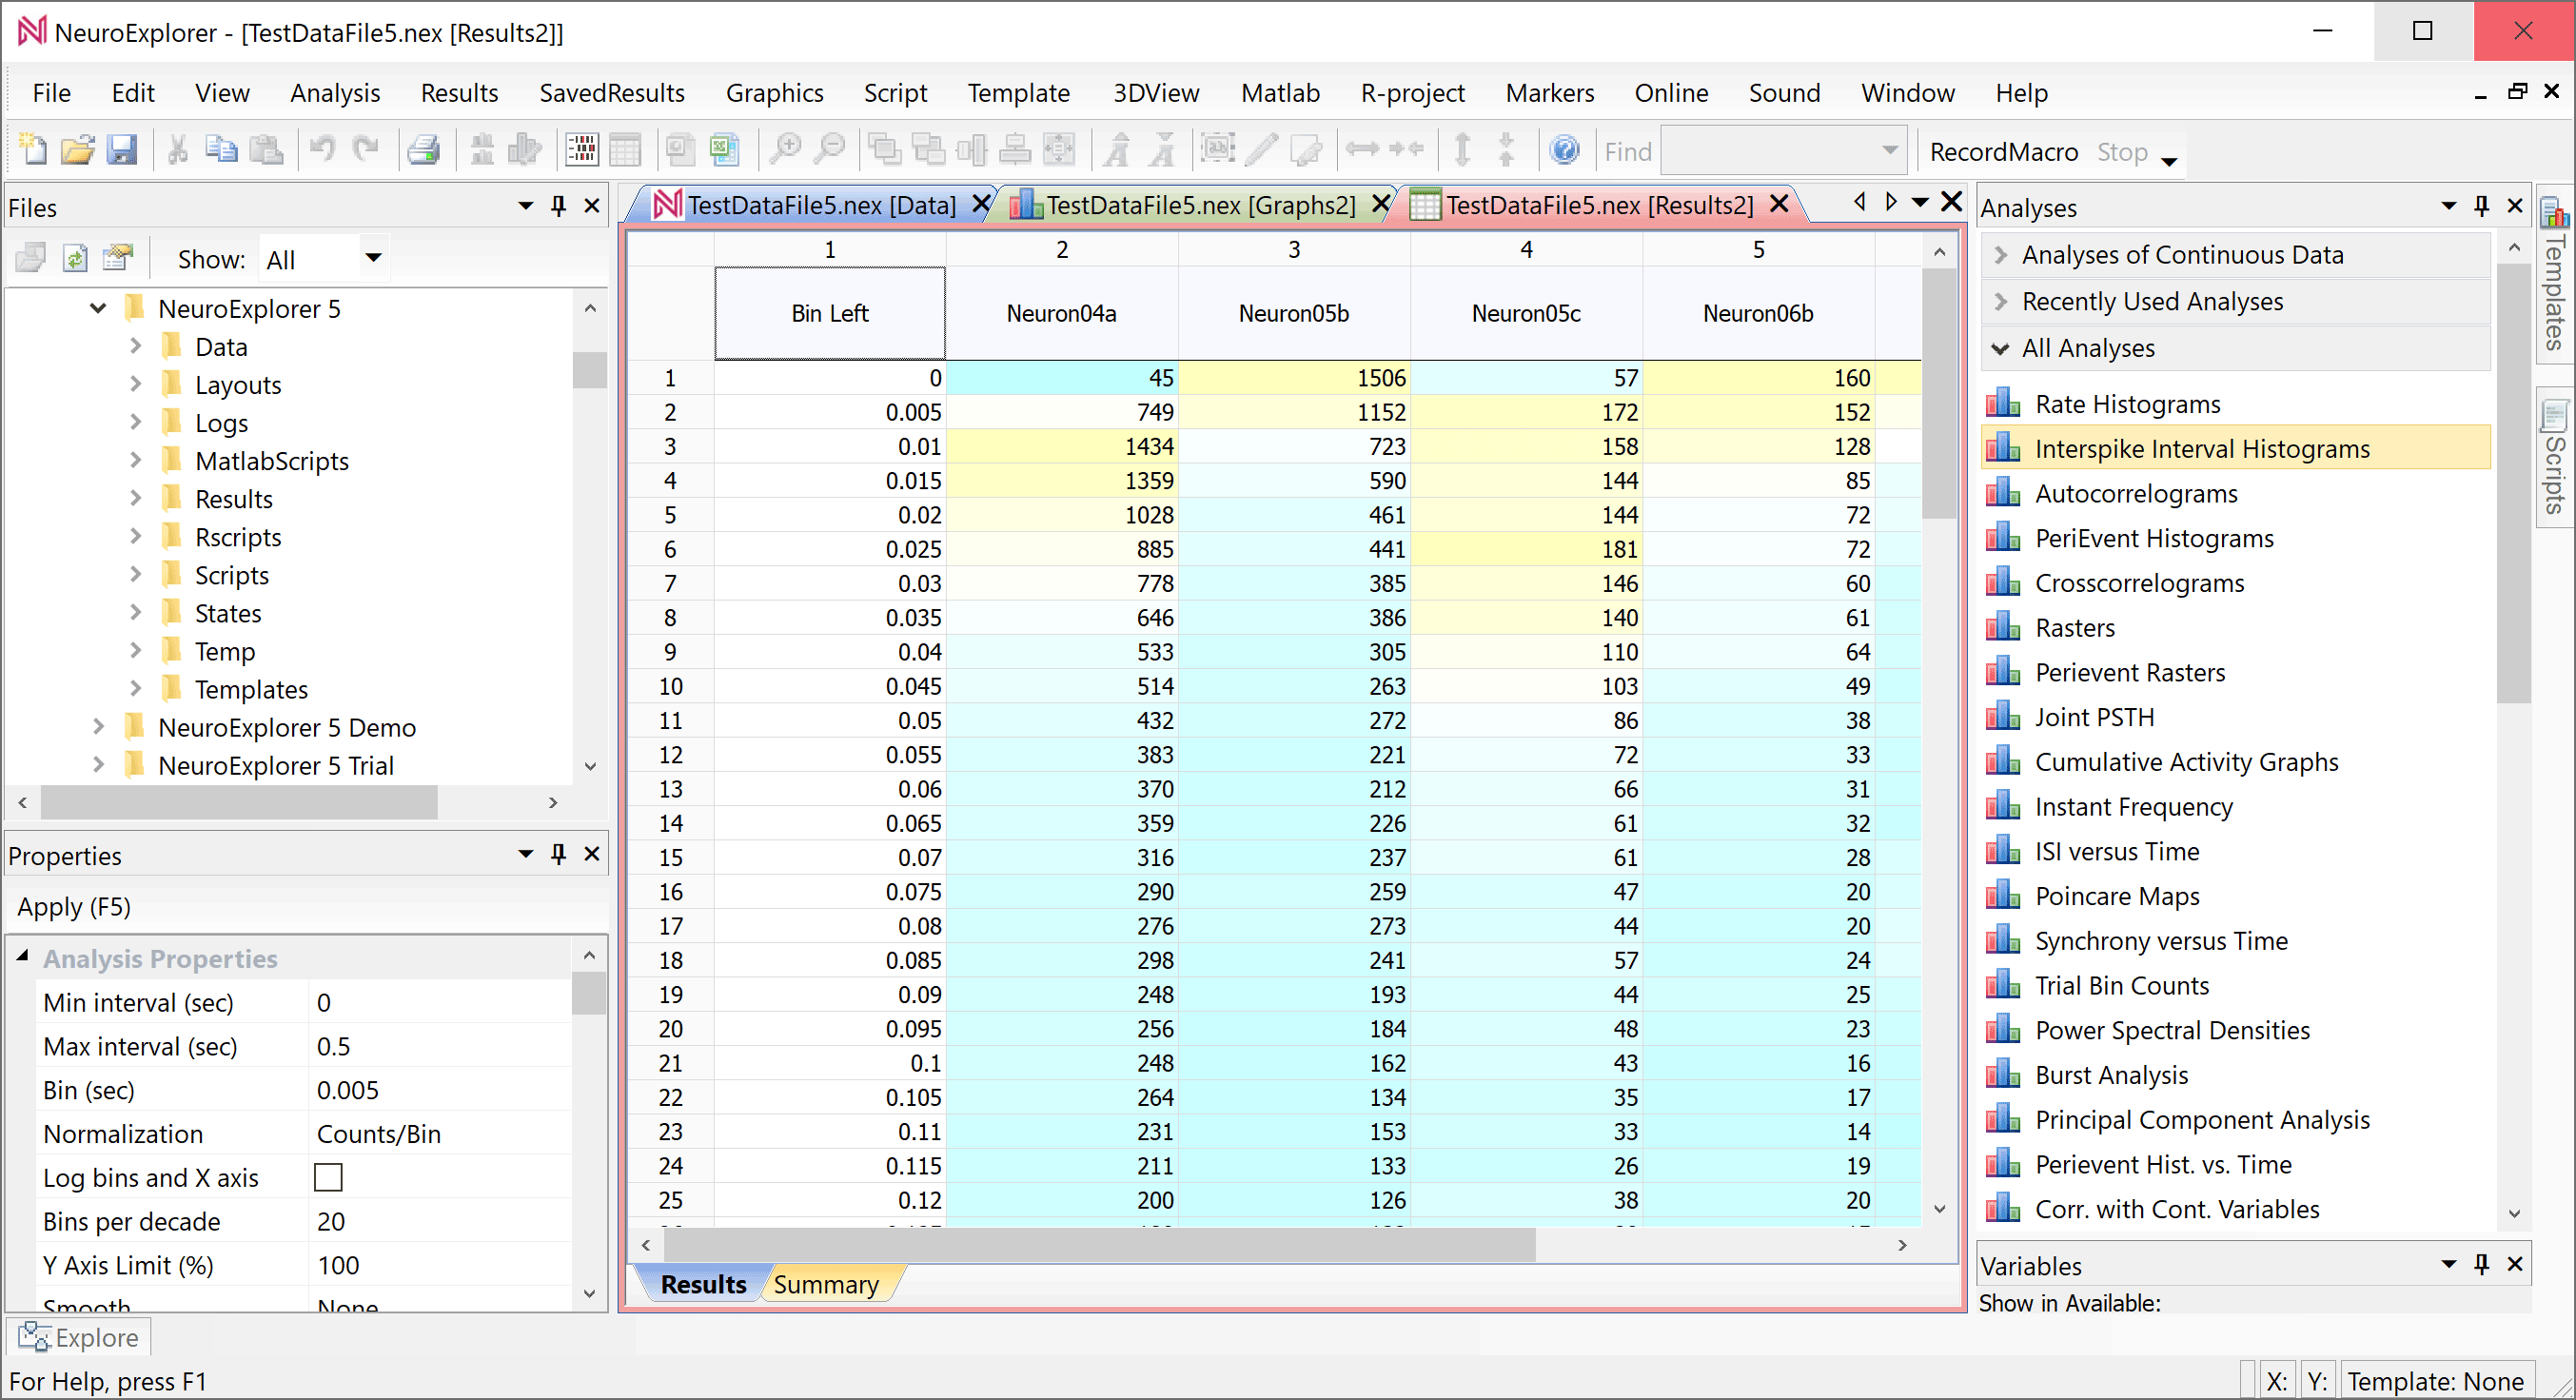
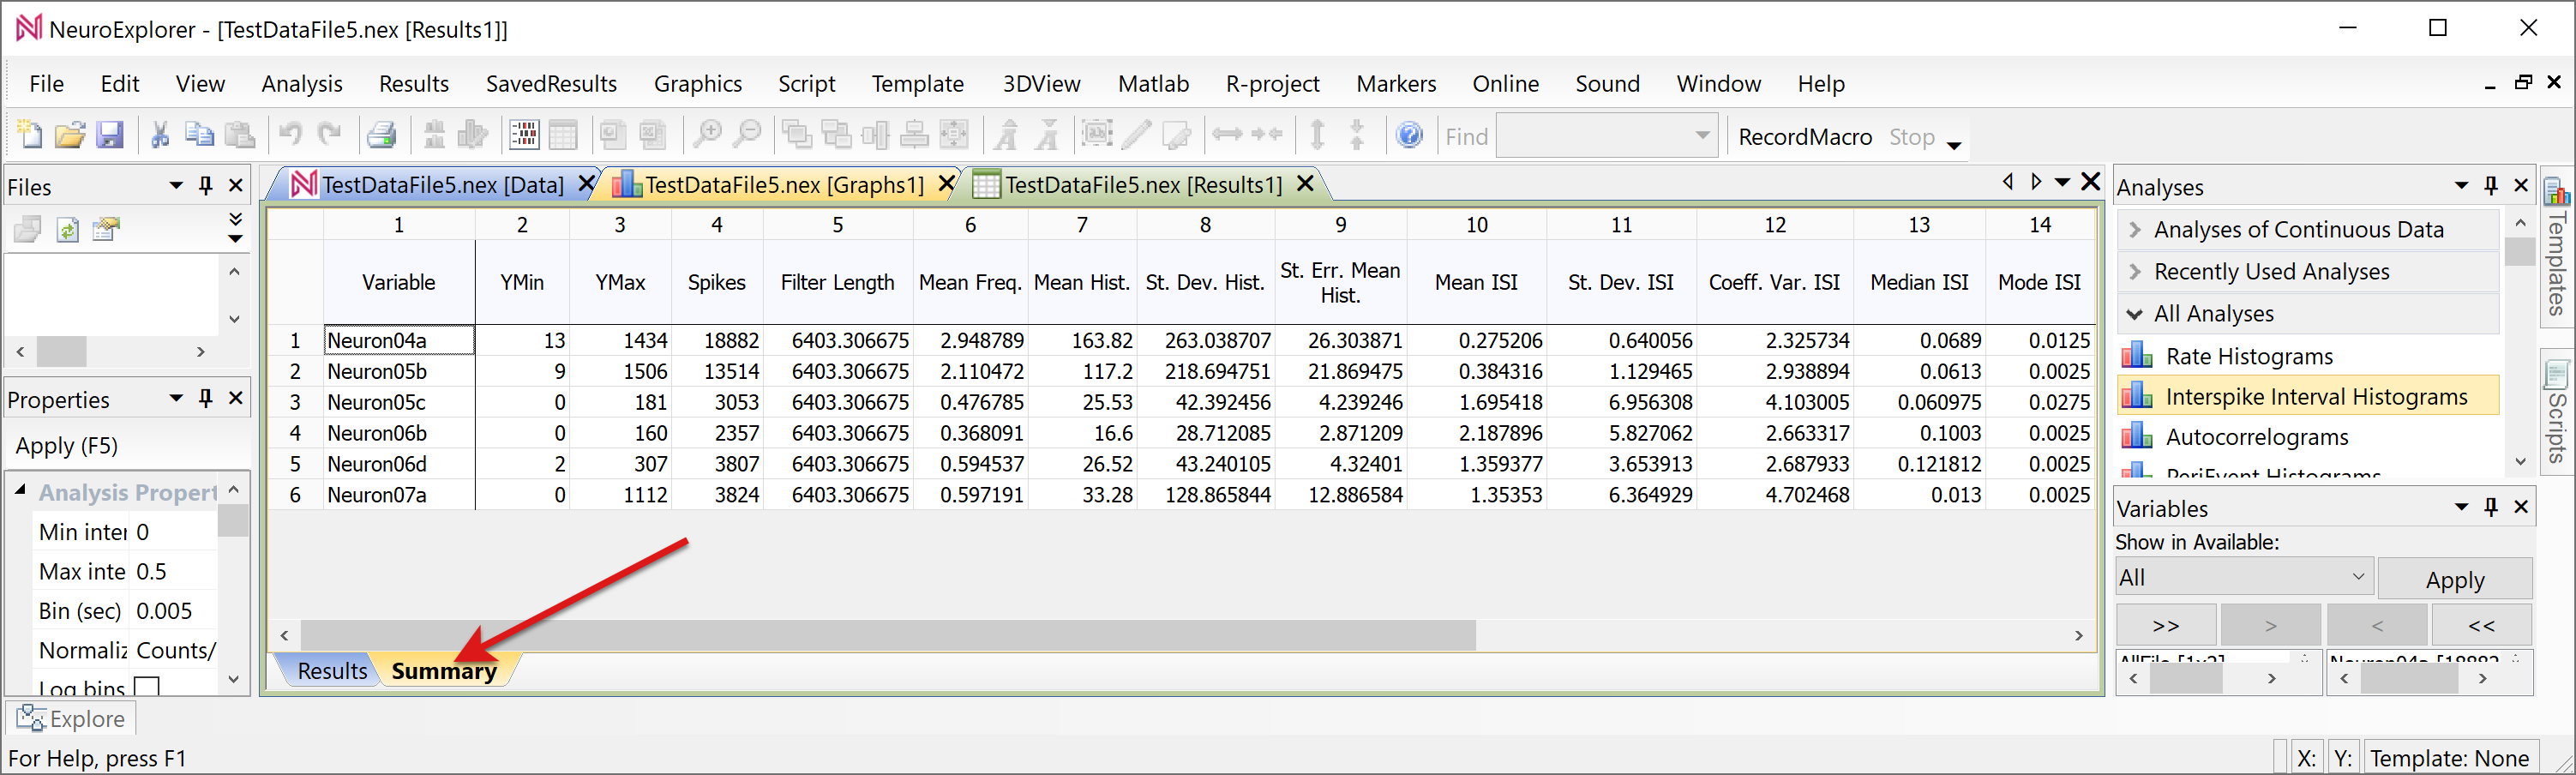
NeuroExplorer will open a new window with numerical analysis results:
Click the Summary tab at the bottom of the numerical results window. NeuroExplorer will open a new window with the summary statistics such as mean firing rate and median interspike interval:
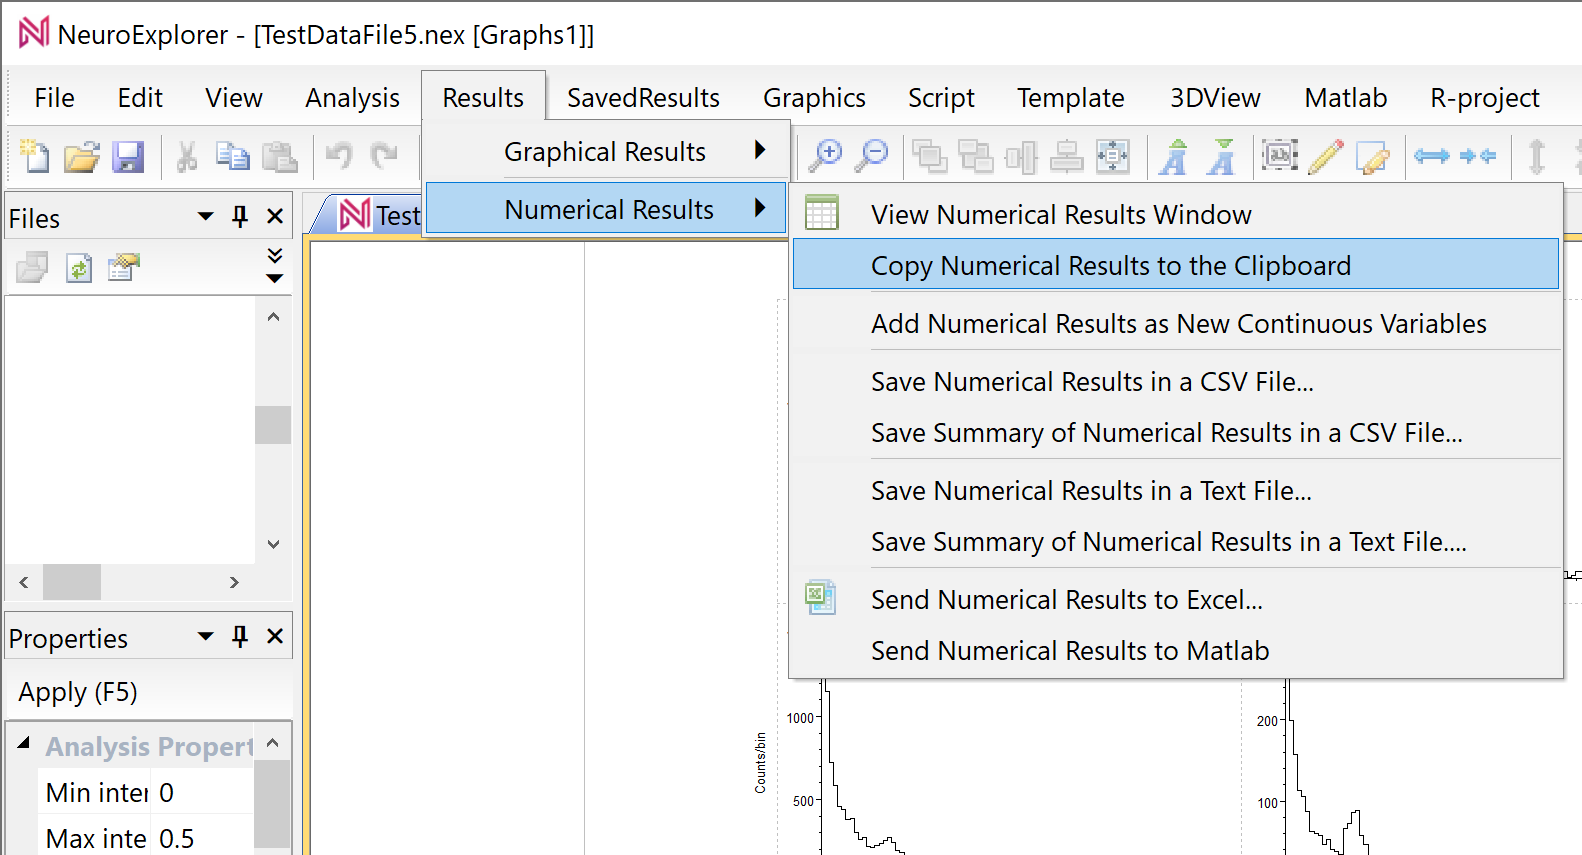
You can save numerical analysis results using Results | Numerical Results menu commands:
Congratulations! You performed your first data analysis in NeuroExplorer!!