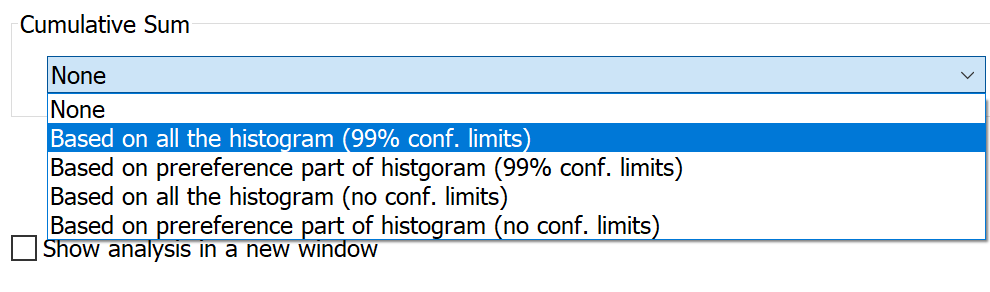
Cumulative Sum Graphs
Use Cumulative Sum option in Analysis Parameters dialog to display Cumulative Sum above histogram-type analyses:
Here is the algorithm that is used to draw optional cumulative sum graphs above the histograms.
Suppose we have a histogram with bin counts bc[i], i=1,...,N.
Cumulative Sum Graph displays the following values cs[i]:
for bin 1: cs[1] = bc[1] - A
for bin 2: cs[2] = bc[1]+bc[2] - A*2
for bin 3: cs[3] = bc[1]+bc[2]+bc[3] - A*3, etc.
The value of A depends on the selected Cumulative Sum option:
A is equal to average of all bc[i] if you select “Based on all the histogram” option
A is equal to average of all bc[i] for bins that are before zero on time scale if you select “Based on prereference part of histogram” option.
If you use “Based on all the histogram” option, the value of the cumulative sum for the last bin is always zero:
cs[N] = bc[1]+bc[2]+...bc[N] - A*N, where A = (bc[1]+bc[2]+...bc[N])/N.