Showing Analog Signals in Spectrograms
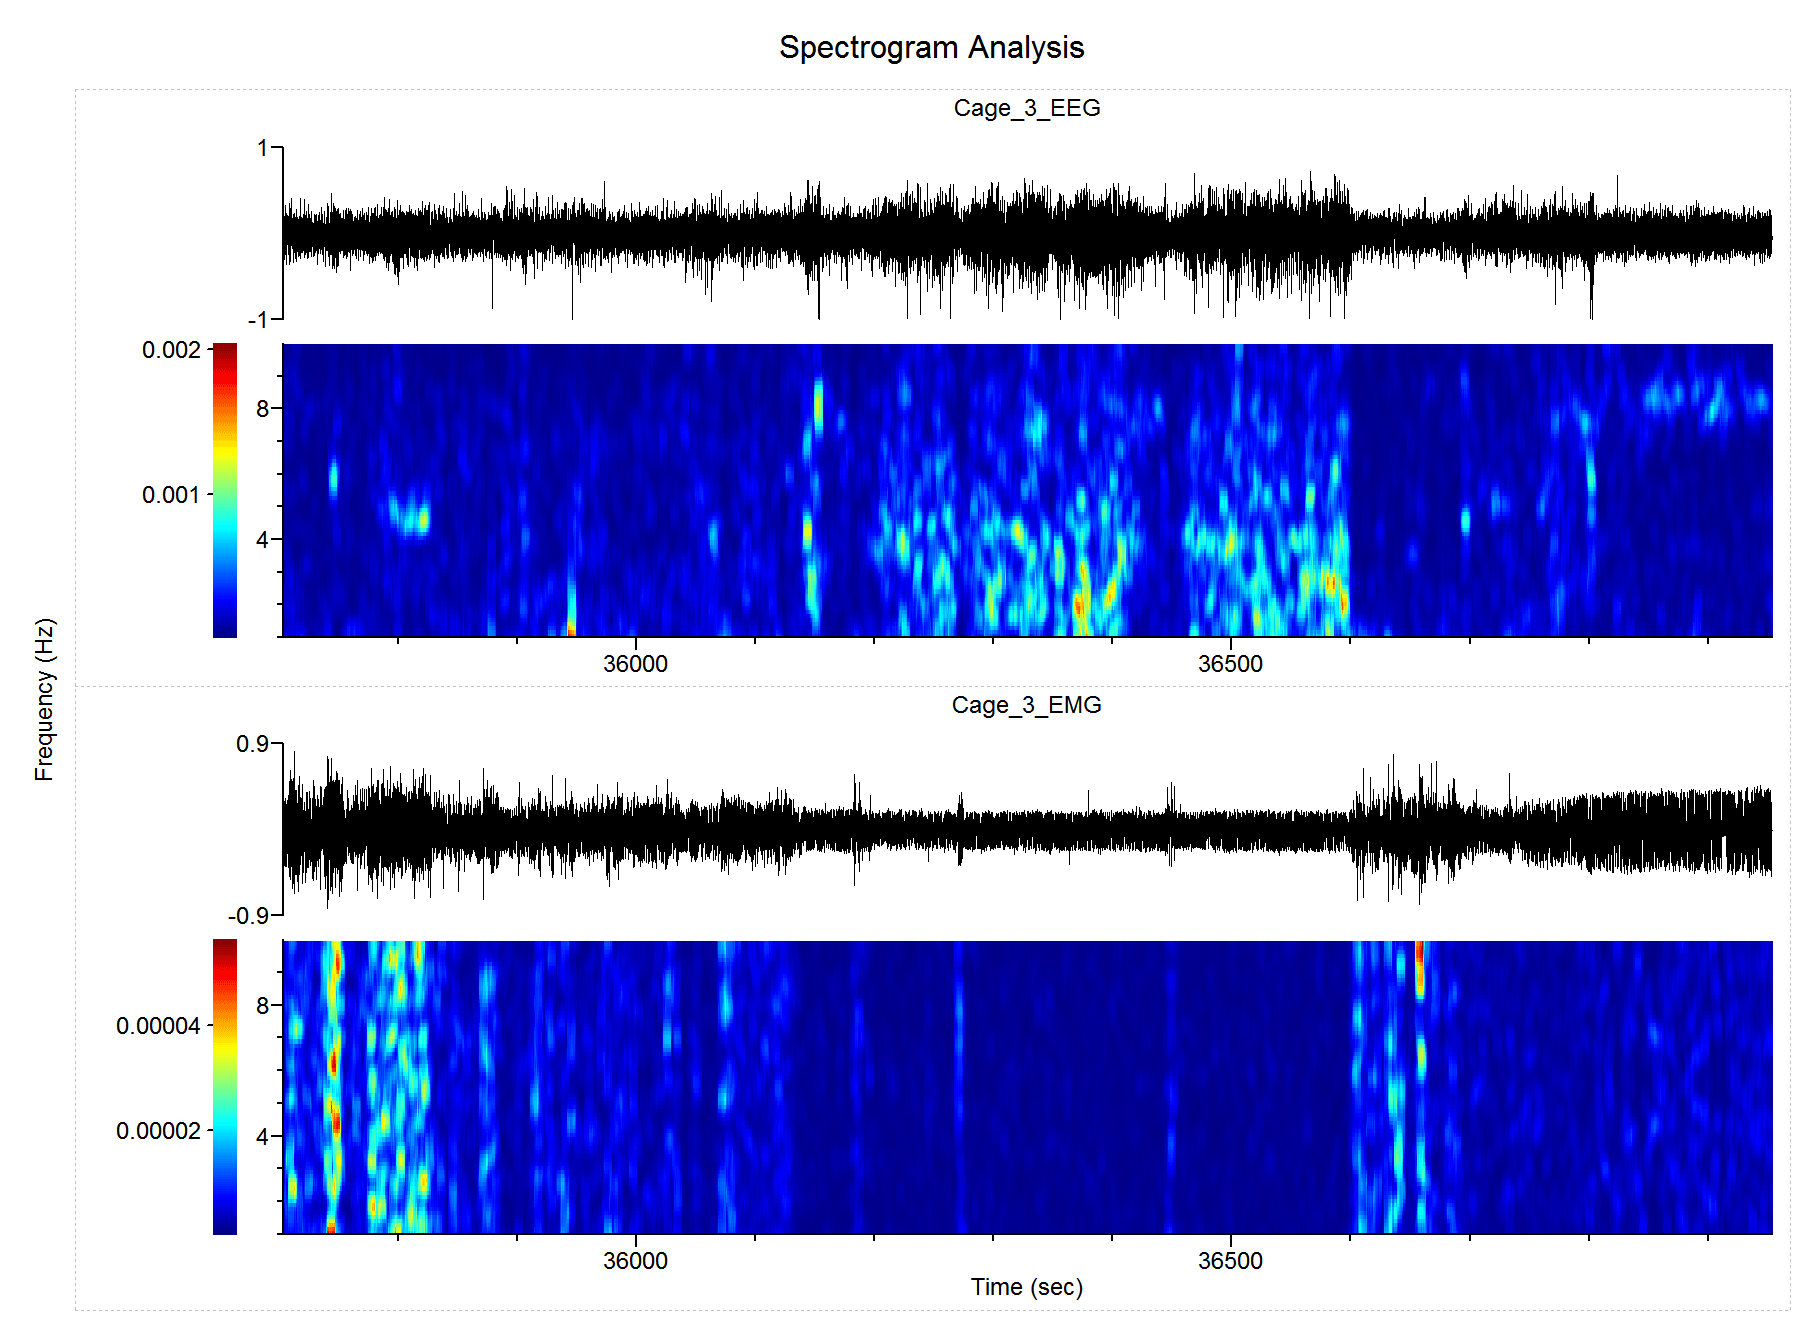
NeuroExplorer 5.023 (released on December 16, 2015) adds a new option in Spectrogram Analysis – ability to draw analog signal above each spectrogram. The signal is drawn for the time values specified in the spectrogram X axis. It is recommended that the Spectrogram analysis option X Axis corresponds to the Center of Sliding Window is used.