Waveform Comparison
This analysis can display:
Means and standard deviations of the waveform variables in specified time intervals
Waveforms in the principal component space
Trough and peak values and other features of the waveforms
Parameters
Parameter |
Description |
|---|---|
Select Data |
If Select Data is From Time Range, only the data from the specified (by Select Data From and Select Data To parameters) time range will be used in analysis. See also Data Selection Options. |
Select Data From |
Start of the time range in seconds. |
Select Data To |
End of the time range in seconds. |
Interval filter |
Specifies the interval filter(s) that will be used to preselect data before analysis. See also Data Selection Options. |
What to Draw |
Specifies graphics output (means and standard deviations of waveforms, projections in the Principal Component space or trough and peak values). |
Draw Variation |
An option to draw waveform variation as a colored background (means and standard deviations display). |
Variation (standard deviations) |
Number of standard deviations in the colored background around waveform mean (means and standard deviations display). |
Variation Background Color |
The color to be used for drawing of the colored background around waveform mean (means and standard deviations display). |
PC X Axis |
Which principal component to use for X axis for the Principal Component projections display. |
PC Y Axis |
Which principal component to use for Y axis for the Principal Component projections display. |
Trough/peak X Axis |
Which waveform feature to use for X axis for the trough and peak display. |
Trough/peak Y Axis |
Which waveform feature to use for Y axis for the trough and peak display. |
Peak calculation |
Use the first local maximum after trough or use maximum with the highest value after trough. |
Width at half height baseline |
Use the last local maximum before trough as the baseline or use zero as the baseline. |
Calculate pre-threshold time |
If the pre-threshold time in data file is zero, calculate the pre-threshold time as the point in waveform that has the minimum standard deviation for all the waveforms in this channel. |
Pre-threshold time is trough time |
Treat pre-threshold time specified in data file as a trough time. |
Summary of Numerical Results
The following information is available in the Summary of Numerical Results
Column |
Description |
|---|---|
Variable |
Variable name. |
YMin |
Y Axis minimum. |
YMax |
Y Axis maximum. |
Filter Length |
The length of all the intervals of the interval filter (if a filter was used) or the length or the recording session (in seconds) |
Mean Waveform Min |
Minimum of the mean waveform. |
Mean Waveform Max |
Maximum of the mean waveform. |
ProjPc1 |
Principal component display only. Projection to principal component 1. |
ProjPc2 |
Principal component display only. Projection to principal component 2. |
ProjPc3 |
Principal component display only. Projection to principal component 3. |
ProjPc4 |
Principal component display only. Projection to principal component 4. |
TroughTime |
Trough/peak display only. Trough time in milliseconds. |
TroughValue |
Trough/peak display only. Trough value in milliVolts. |
PeakTime |
Trough/peak display only. Peak time in milliseconds. |
PeakValue |
Trough/peak display only. Peak value in milliVolts. |
TroughToPeakDuration |
Trough/peak display only. Distance in time from trough to peak (milliseconds). |
WidthAtHalfHeight |
Trough/peak display only. Width of the trough at half height (milliseconds). |
TroughToPeakSlope |
Trough/peak display only. Angle of the line from trough to peak (degrees). |
Algorithm
The program selects waveforms in the specified time range and the interval filter(s) and calculates the mean and the standard deviation of the selected waveforms.
Principal components are calculated from all the waveforms of the given waveform variable.
First, the matrix of covariances between waveform points (c[t, s]) is calculated:
c[t, s] = covariance between vectors waveform_value[t, *] and waveform_value[s,*], s, t = 1, ...,number_of_points_in_each_waveform.
Then, the eigenvalues and eigenvectors are calculated for the matrix c[t, s].
The eigenvectors (principal components) are sorted according to their eigenvalues.
The first principal component has the largest eigenvalue.
PCA projection display shows scatter plots where x and y are projections of a waveform to
the specified principal components (projection is a sum of products waveform_value[t]*principal_component_value[t]).
Trough and Peak display
If the pre-threshold time in data file is zero and Calculate pre-threshold time option is enabled, pre-threshold time is calculated as the waveform point with the minimum standard deviation.
If Pre-threshold time is trough time option is not enabled (default), the following algorithm is used:
The algorithm assumes that the threshold crossing down was used to detect waveforms.
Therefore, the algorithm expects that there is a trough in the waveform that is followed by a peak:
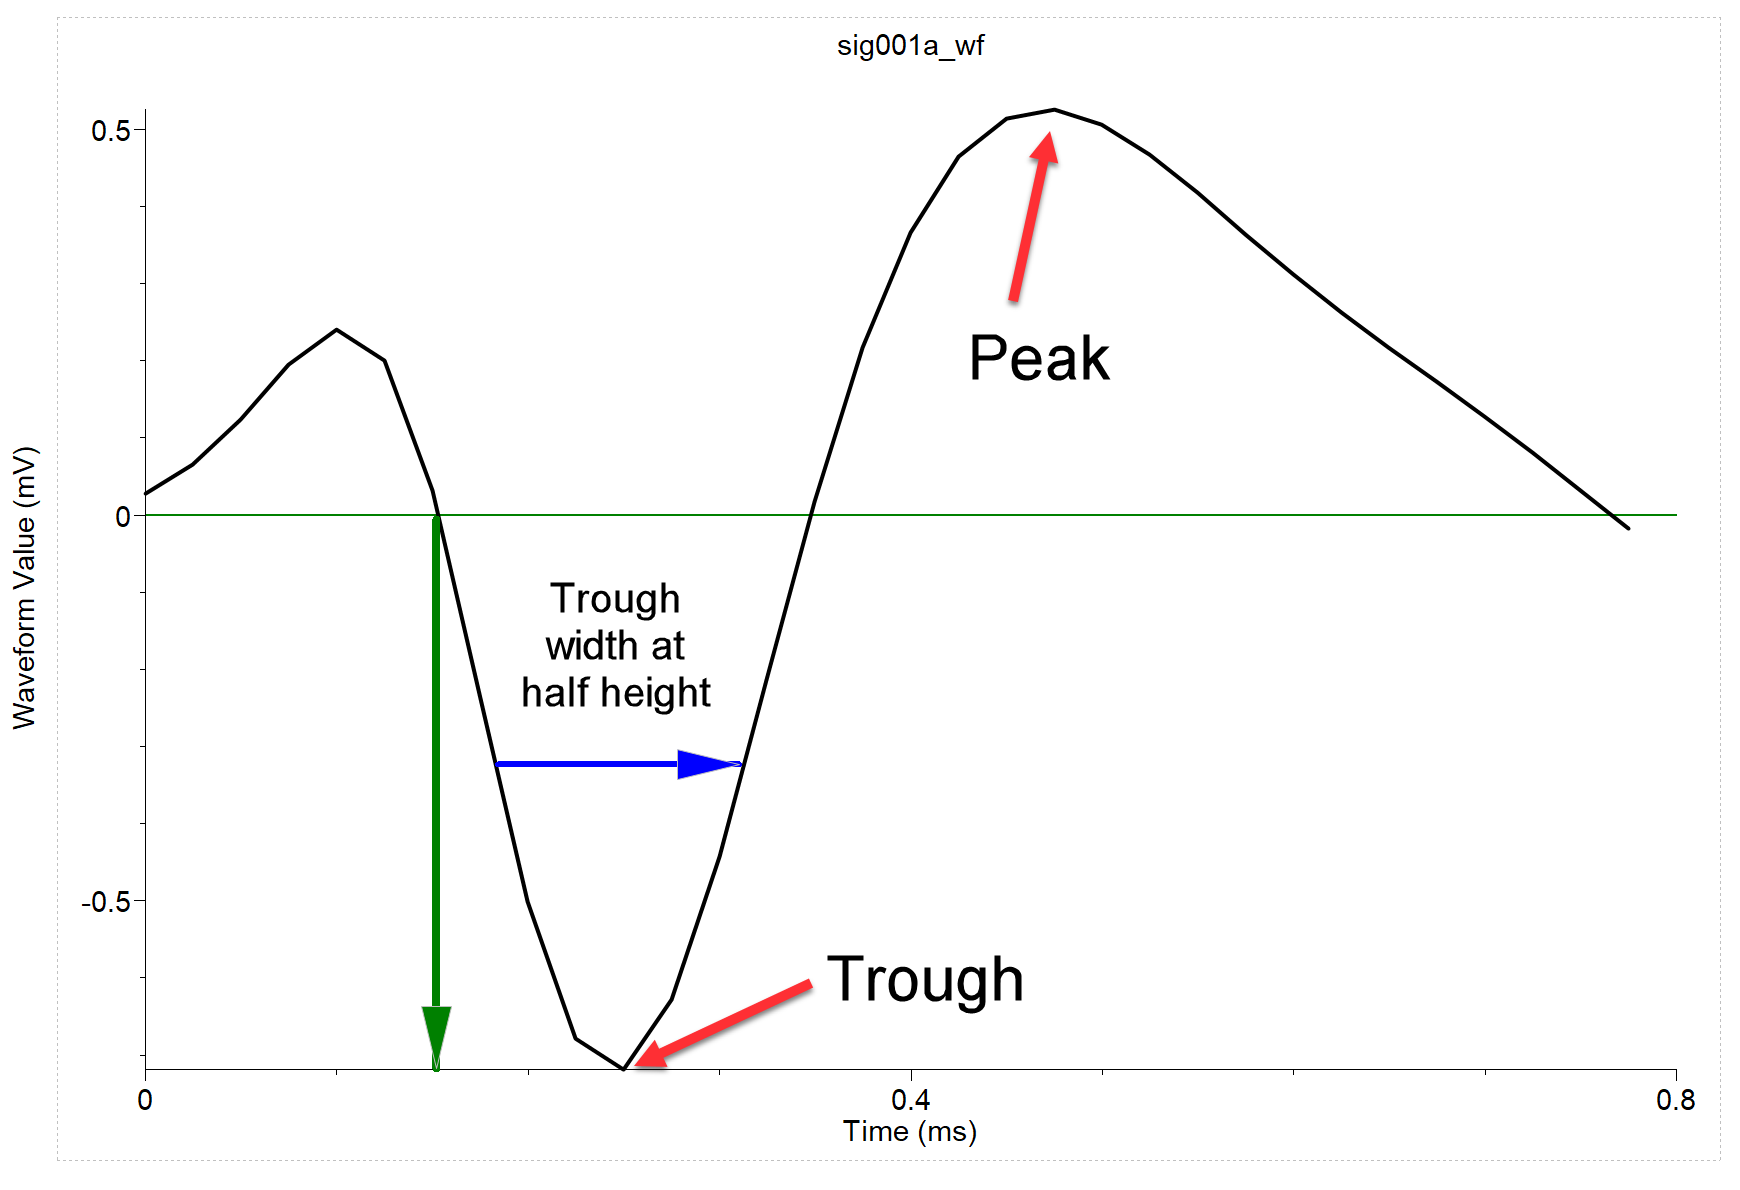
The algorithm for calculating trough and peak is the following:
Each wave is resampled at 1 microsecond resolution using cubic splines.
The value of the waveform at the pre-threshold time is considered the threshold value.
The first local minimum after the threshold crossing is found. The local minimum is the waveform point
w[i]such thatw[i]<w[i-1]andw[i]<w[i+1].This minimum is the trough.
Starting with the trough waveform point, the local maxima of the resampled waveform are found.
The maximum with the highest voltage value is the peak.
The width at half height is a width of the trough negative going dip when the waveform voltage values are equal to
voltage_at_trough/2(blue arrow).
If Pre-threshold time is trough time option is enabled, the following algorithm is used:
Each wave is resampled at 1 microsecond resolution using cubic splines.
The waveform at the pre-threshold time is considered the trough.
The threshold is calculated as
voltage_at_trough/2.Starting with the trough waveform point, the local maxima of the resampled waveform are found.
The maximum with the highest voltage value is the peak.
The width at half height is a width of the trough negative going dip when the waveform voltage values are equal to
voltage_at_trough/2.