Burst Analysis
This analysis identifies bursts in spike trains. Burst start and end times, duration of each burst and other burst statistics are calculated.
For each neuronal variable, a new interval variable can also be created that would contain the time intervals corresponding to bursts.
Parameters
Parameter |
Description |
|---|---|
Algorithm |
Selection of MaxInterval, Surprise or Firing Rate Based algorithms. |
Max. Interval to Start Burst |
Maximum interspike interval to start the burst (in seconds, MaxInterval method). |
Max. Interval to End Burst |
Maximum interspike interval to end the burst (in seconds, MaxInterval method). |
Min. Interburst Interval |
Minimum interval between bursts (in seconds, MaxInterval method). |
Min. Burst Duration |
Minimum burst duration (in seconds, MaxInterval method). |
Min. Number of Spikes |
Minimum number of spikes in the burst (MaxInterval method). |
Min. Surprise |
Minimum surprise of the burst (Surprise method). |
Surprise Method Min. Num. Spikes |
Minimum number of spikes in the burst (Surprise method). |
Surprise Method Min. Duration |
Minimum burst duration (Surprise method). |
Surprise Merge Bursts |
Merge bursts (Surprise method). |
Surprise Min. Interburst Interval (sec) |
Merge bursts if interburst interval is less than this parameter (Surprise method). |
Firing Rate Method Bin |
Firing Rate Method Bin (seconds). |
Firing Rate Method Smooth Width |
Width of the Gaussian filter used in Firing Rate Method. |
Firing Rate Method Threshold |
Firing Rate Method Threshold (number of standard deviations). |
Firing Rate Method Minimum Number of Spikes in Burst |
Firing Rate Method Minimum Number of Spikes in Burst. |
Display |
Specifies what burst statistics to display. |
Add Burst Interval Vars. |
An option to create interval variables containing time intervals corresponding to bursts. |
Select Data |
If Select Data is From Time Range, only the data from the specified (by Select Data From and Select Data To parameters) time range will be used in analysis. See also Data Selection Options . |
Select Data From |
Start of the time range in seconds. |
Select Data To |
End of the time range in seconds. |
Interval filter |
Specifies the interval filter(s) that will be used to preselect data before analysis. See also Data Selection Options. |
Send to Excel |
An option to send numerical results or summary of numerical results to Excel. See also Excel Options . |
Sheet Name |
The name of the worksheet in Excel where to copy the numerical results. |
TopLeft |
Specifies the Excel cell where the results are copied. Should be in the form CR where C is Excel column name, R is the row number. For example, A1 is the top-left cell in the worksheet. |
Summary of Numerical Results
The following information is available in the Summary of Numerical Results
Column |
Description |
|---|---|
Variable |
Variable name. |
YMin |
Burst rate histogram minimum. |
YMax |
Burst rate histogram maximum. |
Spikes |
The number of spikes used in spectrum calculation. |
Filter Length |
The length of all the intervals of the interval filter (if a filter was used) or the length or the recording session (in seconds). |
Mean Frequency |
Mean firing rate (Spikes/Filter_Length). |
Num Bursts |
Number of bursts. |
Bursts Per Second |
Burst rate in bursts per second. |
Bursts Per Minute |
Burst rate in bursts per minute. |
% of Spikes in Bursts |
Percent of spikes in bursts. |
Mean Burst Duration |
Mean duration of burst (in seconds). |
St. Dev. of Burst Duration |
Standard deviation of burst duration. |
Mean Spikes in Burst |
Average number of spikes in burst. |
St. Dev. of Spikes in Burst |
Standard deviation of the number of spikes in burst. |
Mean ISI Burst |
Mean interspike interval in burst. |
St. Dev of ISI in Burst |
Standard deviation of interspike intervals in burst. |
Mean Freq. in Burst |
Mean firing rate |
St. Dev. of Freq. in Burst |
Standard deviation of |
Mean Peak Frequency in Burst |
Mean of |
St. Dev. Peak Frequency in Burst |
Standard deviation of |
Mean Interburst Interval |
Average length (in seconds) of interburst interval. Interburst interval is the interval from the end of the previous burst to the start of the current burst. |
St. Dev. of Interburst Interval |
Standard deviation of the interburst intervals. |
Mean Burst Surprise |
Average burst surprise. |
St. Dev. Burst Surprise |
Standard deviation of burst surprise. |
Algorithm
For each spike train, NeuroExplorer identifies bursts and calculates burst start and end times,
burst duration, number of spikes in burst, mean ISI in burst and peak frequency (1/min_interspike_interval) in burst.
Optionally, creates a new Interval variable and stores all the burst intervals in this variable.
MaxInterval Method
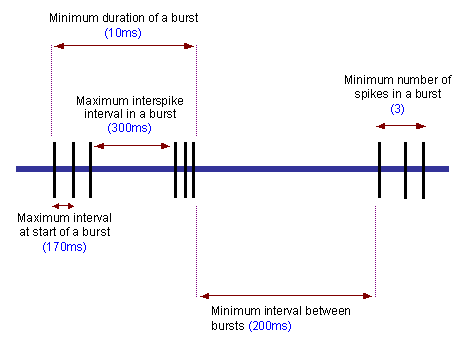
Find all the bursts using the following algorithm:
Scan the spike train until an interspike interval is found that is less than or equal to Max. Interval to Start Burst.
While the interspike intervals are less than Max. Interval to End Burst, they are included in the burst.
If the interspike interval is more than Max. Interval to End Burst, the burst ends.
Merge all the bursts that are less than Min. Interval Between Bursts apart.
Remove the bursts that have duration less than Min. Duration of Burst or have fewer spikes than Min. Number of Spikes.
Surprise Method
First, the mean firing rate (
Freq) and mean interspike interval (MeanISI) of the neuron are calculated.
Freq = NumberOfSpikes / (FileEndTime - FileStartTime)
MeanISI = 1 / Freq
ISIToStartBurst = MeanISI / 2
ISIToEndBurst = MeanISI
NeuroExplorer scans the spike train until it finds two sequential ISI’s so that each of those ISIs is less than
ISIToStartBurst. The surprise of the resulting 3-spike sequence is calculated:If we assume that a random variable
Phas a Poisson distribution with parameterFreqand we also assume that the burst hasNspikes and the distance from the first to the last spike of the burst isT, then the surprise of the burst is:S = - log10 (Probability that P has at least N points in time interval of length T)
NeuroExplorer adds the spikes to the end of the burst until the first ISI that is more than
ISIToEndBurstand calculates surprise for each of the bursts (with 3 initial spikes, 4 spikes, 5 spikes, etc.). The burst with maximum surpriseSmaxis then selected.NeuroExplorer removes the spikes from the beginning of the burst and calculates the surprise for each of the reduced bursts. The burst with maximum surprise
Smaxis then selected.If
Smaxis more thanMinSurpriseand the number of spikes in the burst is more than Surprise Method Min. Num. Spikes, NeuroExplorer adds the burst to the result.
Firing Rate Based Method
Firing rate histogram with the specified bin size is calculated.
Rate histogram is smoothed using Gaussian smooth filter of the specified width. See Post-Processing Options for details of filter design.
Mean and Standard Deviation (STD) of the smoothed rate histogram are calculated.
Bins that have smooth histogram values of more than
Mean+STD*Firing_Rate_Method_Thresholdare considered to be in the burst. Burst start is the first spike in the burst bins, burst end is the last spike in the burst bins.Bursts that have fewer spikes than the specified Firing Rate Method Minimum Number of Spikes in Burst are removed.
Reference
Legendy C.R. and Salcman M. (1985): Bursts and recurrences of bursts in the spike trains of spontaneously active striate cortex neurons. J. Neurophysiology, 53(4):926-39.