Perievent Firing Rates
This analysis is similar to Perievent Histograms, but instead of counting numbers of spikes in bins, this analysis uses method based on convolution of a spike train with a fixed kernel function.
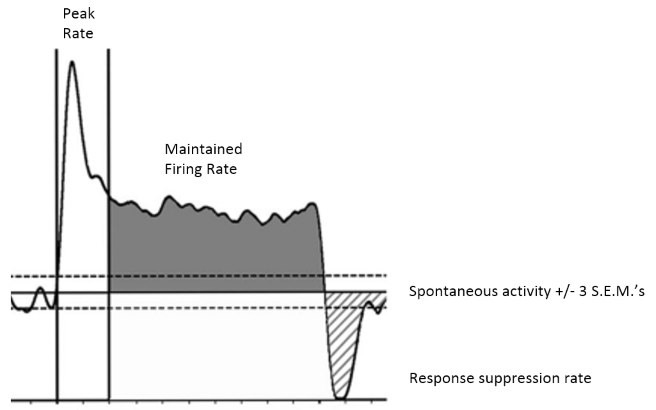
Figure provided by Dr. Maureen McCall, University of Louisville School of Medicine.
Parameters
Parameter |
Description |
|---|---|
Reference |
Specifies a reference neuron or event. |
XMin |
Time axis minimum in seconds. |
XMax |
Time axis maximum in seconds |
Kernel Type |
The type of kernel to be used (Boxcar, Triangle, Gaussian or Exponential) |
Kernel Width (sec) |
Kernel width in seconds |
Draw Variation |
An option to draw variation of firing across reference events as a colored background. |
Variation (st. err. mean) |
Number of standard errors of mean in the colored background around firing rate mean. |
Variation Background Color |
The color to be used for drawing of the colored background around firing rate mean. |
Draw Mean and Standard Error of Mean |
An option to draw expected mean firing rate and plus/minus Variation * S.E.M. |
Calculate Response Statistics |
An option to calculate response statistics. |
Spontaneous Activity Interval Filter |
The interval variable used to calculate spontaneous activity mean and S.E.M. |
Peak Time Frame Start (seconds) |
The start of the time interval (relative to reference) used to calculate peak firing rate. |
Peak Time Frame End (seconds) |
The end of the time interval (relative to reference) used to calculate peak firing rate. |
Maintained Firing Rate Time Frame Start (seconds) |
The start of the time interval (relative to reference) used to calculate maintained firing rate. |
Maintained Firing Rate Time Frame End (seconds) |
The end of the time interval (relative to reference) used to calculate maintained firing rate. |
Select Data |
If Select Data is From Time Range, only the data from the specified (by Select Data From and Select Data To parameters) time range will be used in analysis. See also Data Selection Options. |
Select Data From |
Start of the time range in seconds. |
Select Data To |
End of the time range in seconds. |
Interval filter |
Specifies the interval filter that will be used to preselect data before analysis. See also Data Selection Options. |
Send to Matlab |
An option to send the matrix of numerical results to Matlab. See also Matlab Options. |
Matrix Name |
Specifies the name of the results matrix in Matlab workspace. |
Matlab command |
Specifies a Matlab command that is executed after the numerical results are sent to Matlab. |
Send to Excel |
An option to send numerical results or summary of numerical results to Excel. See also Excel Options. |
Sheet Name |
The name of the worksheet in Excel where to copy the numerical results. |
TopLeft |
Specifies the Excel cell where the results are copied. Should be in the form CR where C is Excel column name, R is the row number. For example, A1 is the top-left cell in the worksheet. |
Summary of Numerical Results
The following information is available in the Summary of Numerical Results
Column |
Description |
|---|---|
Variable |
Variable name. |
XMin |
Time axis minimum. |
XMax |
Time axis maximum. |
YMin |
Y axis minimum. |
YMax |
Y axis maximum. |
FiringRateMin |
Firing rate minimum. |
FiringRateMax |
Firing rate maximum. |
NumRefEvents |
The number of reference events used in calculation. |
NumSpikes |
The number of spikes used in calculation. |
Filter Length |
The length of all the intervals of the interval filter (if a filter was used) or the length or the recording session (in seconds) |
ResponsePresent |
1 if firing rate exceeded |
PeakRate |
Peak firing rate (max. of firing rate in Peak Time Frame). |
PeakPosition |
Peak firing rate position in seconds. |
MaintainedRate |
Mean firing rate in Maintained Time Frame. |
ResponseDuration |
Response duration in seconds. |
SupressionStart |
Suppression start time in seconds. |
SupressionEnd |
Suppression end time in seconds. |
Algorithm
The firing rate is estimated using convolution of a spike train with a fixed kernel function:
FiringRate(t) = sum of K(t-t[i]), where K(t) is a kernel function, t[i] are spike occurrence times.
The following kernel functions are used
Boxcar(t) = 1/(2*sqrt(3)*w), t in interval [-sqrt(3)*w, sqrt(3)*w]

Triangle(t) = (sqrt(6)*w - abs(t))/(6*w*w), t in interval [-sqrt(6)*w, sqrt(6)*w]

Gaussian(t) = exp(-t*t/(2*w*w))/(sqrt(2*PI)*w), t in interval [-5*w, 5*w]

Exponential(t) = exp(-sqrt(2)*abs(t)/w/(sqrt(2)*w), t in interval [-5*w, 5*w]
w is a kernel width parameter (square root of the integral of t square multiplied by kernel equals w).
It is specified as the Kernel Width analysis parameter.
For each reference event at time Ref[k], FiringRate(t) is calculated for the spikes within time interval
[Ref[k]+\ **XMin**, Ref[k]+\ **XMax**]
The average firing rate across all reference event is then calculated and displayed.
To calculate response statistics, spontaneous mean and standard error of mean (S.E.M) are calculated:
For each interval in interval variable (specified in Spontaneous Activity Interval Filter), the mean firing rate is calculated. Spontaneous mean is the average of mean rates over all the intervals. S.E.M. is the standard error of mean over all the intervals.
If perievent firing rate exceeded SpontaneuousMean + Variation*S.E.M., ResponsePresent is set to to 1.
ResponseDuration is the time when perievent firing rate drops below SpontaneuousMean.
SupressionStart is the time when perievent firing rate drops below SpontaneuousMean - Variation*S.E.M.
SupressionEnd is the time when perievent firing rate returns to SpontaneuousMean.
SuppressionRate is the minimum firing rate in the interval [SupressionStart, SupressionEnd]
References
Nawrot, Martin, Ad Aertsen, and Stefan Rotter. Single-trial estimation of neuronal firing rates: from single-neuron spike trains to population activity. Journal of neuroscience methods 94.1 (1999): 81-92.
Shigeru Shinomoto. Estimating the Firing Rate. Analysis of Parallel Spike Trains. Springer Series in Computational Neuroscience, Volume 7, 2010, pp 21-35