Correlations With Continuous Variable
This analysis calculates crosscorrelations between a continuously recorded variable and a neuronal firing rate, or crosscorrelations between a continuously recorded variable and another continuous variable.
Parameters
Parameter |
Description |
|---|---|
Reference |
Specifies a reference continuous variable. |
XMin |
Time axis minimum in seconds. |
XMax |
Time axis maximum in seconds. |
Bin Type |
An option to specify how the bin value is determined. If this option is Auto, NeuroExplorer will use the bin equal to the A/D sampling interval of the reference variable. |
Bin |
Bin size in seconds. Used if Bin Type is set to User defined. |
Select Data |
If Select Data is From Time Range, only the data from the specified (by Select Data From and Select Data To parameters) time range will be used in analysis. See also Data Selection Options. |
Select Data From |
Start of the time range in seconds. |
Select Data To |
End of the time range in seconds. |
Interval filter |
Specifies the interval filter(s) that will be used to preselect data before analysis. See also Data Selection Options. |
Smooth |
Option to smooth the histogram after the calculation. See Post-Processing Options for details. |
Smooth Filter Width |
The width of the smooth filter. See Post-Processing Options for details. |
Add to Results / Bin left |
An option to add an additional vector (containing a left edge of each bin) to the matrix of numerical results. |
Add to Results / Bin middle |
An option to add an additional vector (containing a middle point of each bin) to the matrix of numerical results. |
Add to Results / Bin right |
An option to add an additional vector (containing a right edge of each bin) to the matrix of numerical results. |
Send to Matlab |
An option to send the matrix of numerical results to Matlab. See also Matlab Options. |
Matrix Name |
Specifies the name of the results matrix in Matlab workspace. |
Matlab command |
Specifies a Matlab command that is executed after the numerical results are sent to Matlab. |
Send to Excel |
An option to send numerical results or summary of numerical results to Excel. See also Excel Options. |
Sheet Name |
The name of the worksheet in Excel where to copy the numerical results. |
TopLeft |
Specifies the Excel cell where the results are copied. Should be in the form CR where C is Excel column name, R is the row number. For example, A1 is the top-left cell in the worksheet. |
Summary of Numerical Results
The following information is available in the Summary of Numerical Results
Column |
Description |
|---|---|
Variable |
Variable name. |
Reference |
Reference variable name. |
YMin |
Y axis minimum. |
YMax |
Y axis maximum. |
Mean Hist. |
Mean of all the correlation values for this variable. |
St. Dev. Hist |
Standard deviation of all the correlation values for this variable. |
St. Err. Mean Hist |
Standard error of mean of all the correlation values for this variable |
Algorithm
This analysis calculates standard correlograms for two (continuously recorded) vectors. For spike trains and events, NeuroExplorer first calculates the rate histograms with the specified bin size, and then calculates the correlations between the reference variable and the rate histogram.
If x[i], i=1,...N is the vector of all the values of the reference variable
with sampling rate SR and y[i], i=1,...,N is the vector of all the values
of another continuous variable or values of spike train rate histogram, then
correlation[lag_n_seconds] = Pearson correlation between vectors

{ x[1], x[2], ..., x[N-lag_in_samples] }

and

{ y[1+lag_in_samples], y[2+lag_in_samples], ..., y[N] }

where lag_in_samples = lag_in_seconds*SR.
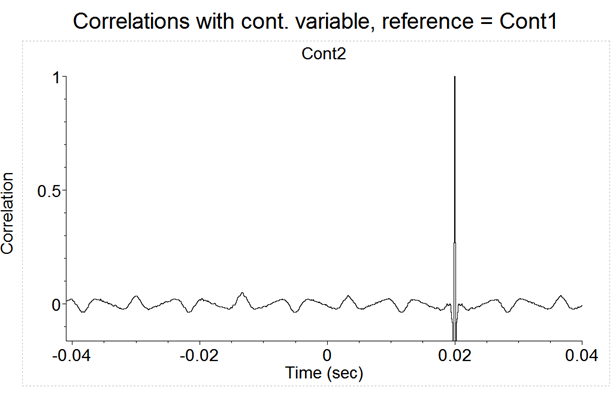
Let’s consider the following example. We have continuous variable Cont1. We create continuous variable Cont2 by running shift operation on Cont1 with shift=0.02s.
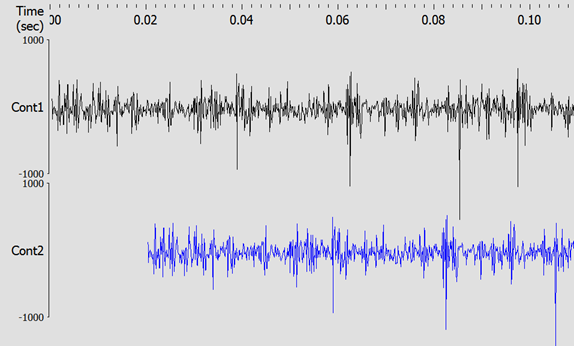
For each value of time t, we have Cont1[t] = Cont2[t+0.02].
This means that if reference is Cont1 and lag_in_seconds = 0.02s,
we will calculate Pearson correlation of identical vectors.
That is, our correlation result will have the highest value close to 1.0 at 0.02 seconds.