Python-based Analysis
This analysis uses a Python script to calculate analysis results.
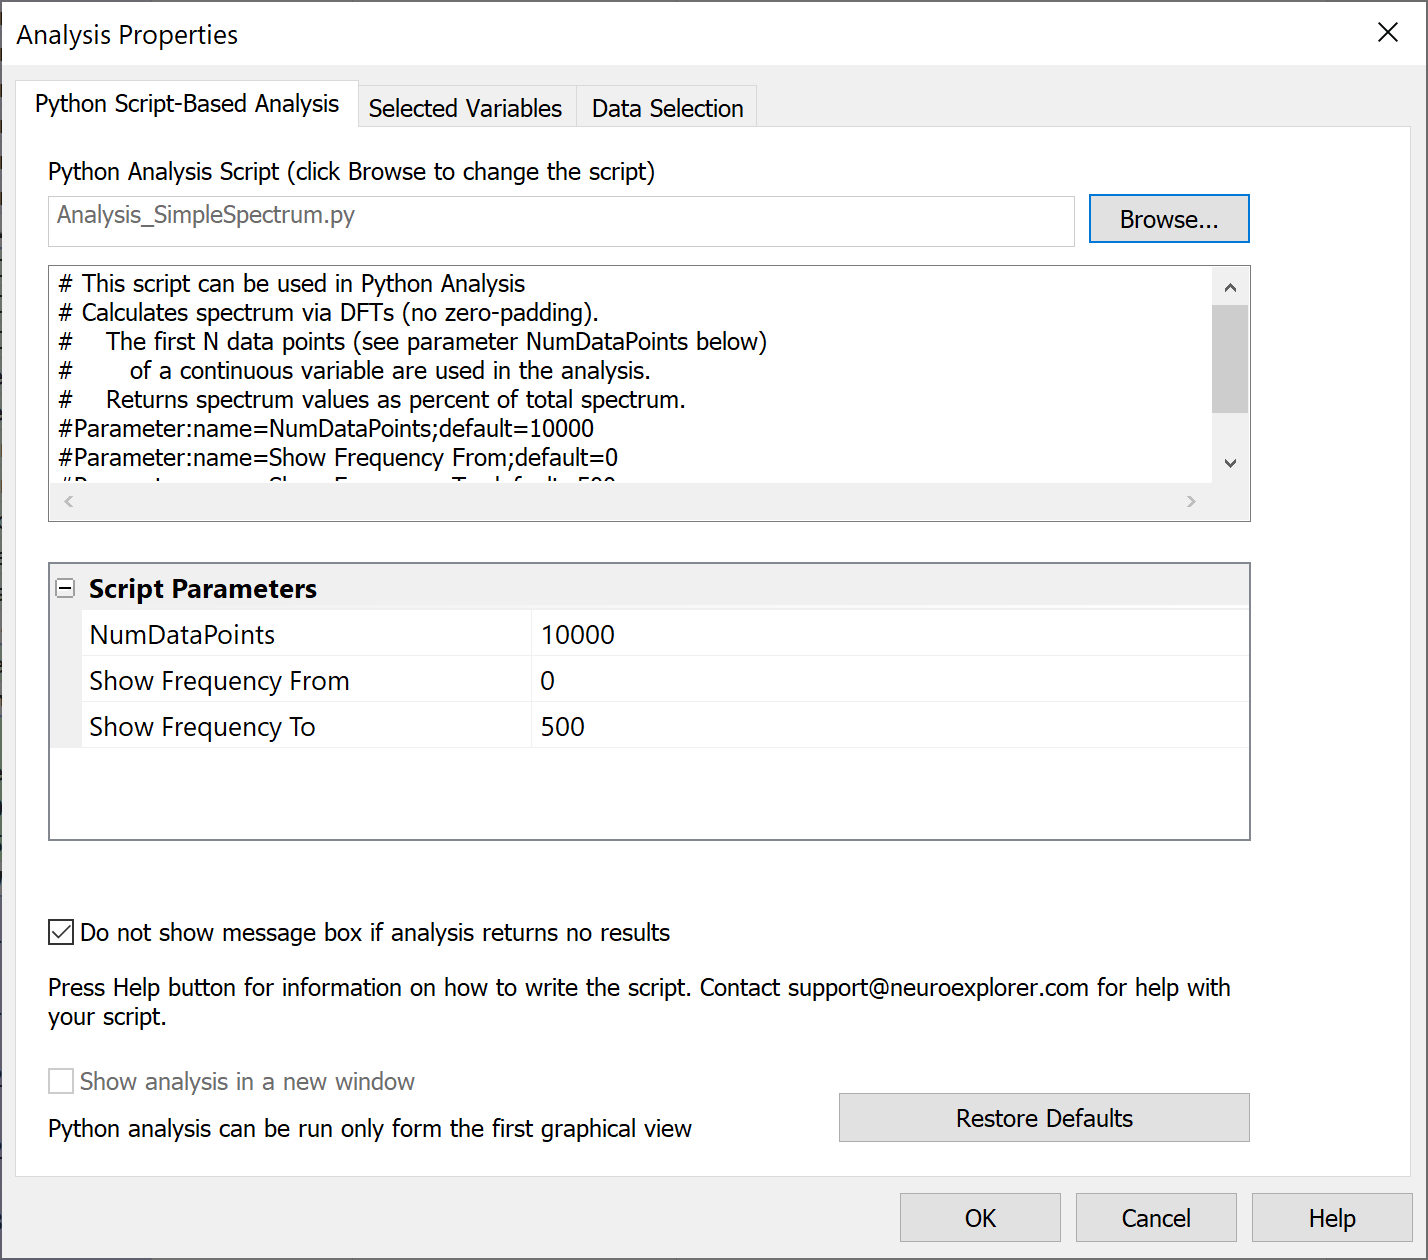
Specify the script using Python analysis dialog:
Parameters
These parameters are shown in the Properties panel, Analysis Properties group.
Parameter |
Description |
|---|---|
Script Path |
Python script path. |
Script Parameters as JSON |
Script Parameters as JSON string. |
Select Data |
If Select Data is From Time Range, only the data from the specified (by Select Data From and Select Data To parameters) time range will be used in analysis. See also Data Selection Options. |
Select Data From |
Start of the time range in seconds. |
Select Data To |
End of the time range in seconds. |
Interval filter |
Specifies the interval filter(s) that will be used to preselect data before analysis. See also Data Selection Options. |
Algorithm
For each selected data variable, NeuroExplorer will execute the specified Python script. If you need to execute the script only once for all selected variables, add this line to the top of the script:
#Option:callOnce
The script can specify script parameters. The specified parameters with be shown in Python Analysis properties dialog.
Script parameter specifications should placed as comments at the top of the script.
Each script parameter specification should be on its own line.
The specification should start with #Parameter:name= followed by the name of the parameter,
semicolon and the default parameter value, for example:
#Parameter:name=NumDataPoints;default=10000
If the parameter is used to select a continuous variable, add ;type=ContChoice:
#Parameter:name=ReferenceContChannel;default=LFP01;type=ContChoice
The following code retrieves the NumDataPoints parameter value that was specified by the user in Python Analysis properties dialog:
inputJson = doc.GetPythonAnalysisInput()
inputPars = json.loads(inputJson)
numValues = int(inputPars['ScriptParameters']['NumDataPoints'])
Use doc.GetPythonAnalysisInput() to get information about the current data variable and to get the values of analysis parameters.
Use doc.SetPythonAnalysisOutput() to specify numerical results of the analysis as JSON string.
The results object should be a dictionary with 'XValues' and 'YValues' properties containing Python lists of numeric values
(see lines with result['XValues'] and result['YValues'] in the script below).
Here is a script that calculates a DFT-based spectrum for a specified Continuous variable:
# This script can be used in Python Analysis
# Calculates spectrum via DFTs (no zero-padding).
#    The first N data points (see parameter NumDataPoints below)
#       of a continuous variable are used in the analysis.
#    Returns spectrum values as percent of total spectrum.
#Parameter:name=NumDataPoints;default=10000
#Parameter:name=Show Frequency From;default=0
#Parameter:name=Show Frequency To;default=500

import nex
import json
import math

def ReturnEmptyResult(doc):
    result = {}
    result['XAxisLabel'] = 'Frequency (Hz)'
    result['YAxisLabel'] = 'Spectrum (%)'
    result['XValues'] = [0, 1]
    result['YValues'] = [0, 0]
    doc.SetPythonAnalysisOutput(json.dumps(result))

# main calculate function of the script
# called in the last line of the script below
# in Python Analysis, this function is called for each selected variable
def Calculate():
    doc = nex.GetActiveDocument()
    # get the variable info and values of script parameters
    inputJson = doc.GetPythonAnalysisInput()
    if not inputJson:
        raise ValueError('this script should be run from Python Analysis only')

    inputPars = json.loads(inputJson)

    variable = inputPars['Variable']

    if variable['Type'] != 'Continuous':
        ReturnEmptyResult(doc)
        return

    # get parameter values in numeric form
    numValues = int(inputPars['ScriptParameters']['NumDataPoints'])
    freqFrom = float(inputPars['ScriptParameters']['Show Frequency From'])
    freqTo = float(inputPars['ScriptParameters']['Show Frequency To'])

    # get continuous values
    v = doc[variable['Name']].ContinuousValues()
    numberOfContValues = len(v)
    if numberOfContValues == 0:
        ReturnEmptyResult(doc)
        return
    if numberOfContValues > numValues:
        v = v[0:numValues]
        numberOfContValues = len(v)

    samplingRate = float(variable['SamplingRate'])
    spectrumStep = samplingRate/numberOfContValues

    # this is the main spectrum calculation
    spectrum = nex.Spectrum(v)

    s = sum(spectrum)

    result = {}
    result['XAxisLabel'] = 'Frequency (Hz)'
    result['YAxisLabel'] = 'Spectrum (%)'
    result['XValues'] = []
    result['YValues'] = []
    for i in range(len(spectrum)):
        freq = i*spectrumStep
        if freq >= freqFrom and freq <= freqTo:
            result['XValues'].append(freq)
            if s == 0:
                result['YValues'].append(0.0)
            else:
                result['YValues'].append(100.0*spectrum[i]/s)

    if len(result['XValues']) == 0:
        ReturnEmptyResult(doc)
    else:
        doc.SetPythonAnalysisOutput(json.dumps(result))


Calculate()