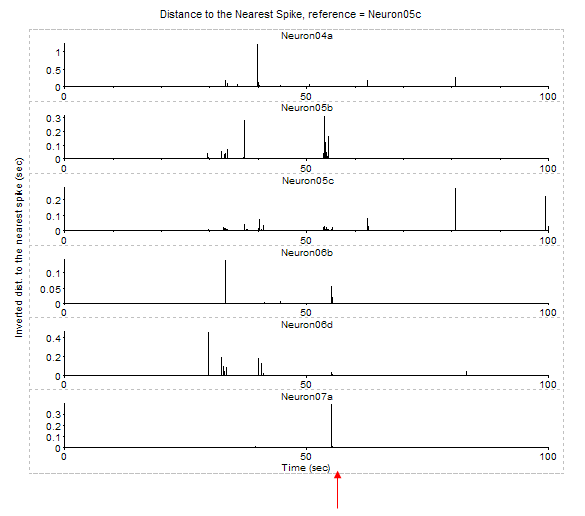
Synchrony vs. Time
For each spike, this graph shows the distance from this spike to the closest spike (timestamp) in the reference event.
This analysis is useful in identifying the moments in time when several neurons are in sync with the reference neuron. To do this, you need to select Inverted Distance. Then, high values will indicate spikes that are close to each other. Also, it is useful to specify that the graphs are shown in 1 column (in Num. Columns in Properties panel).
The red arrow in the picture below shows a moment in time where several neurons have almost-synchronous spikes with the reference.
Parameters
Parameter |
Description |
|---|---|
XMin |
Time axis minimum in seconds. |
XMax |
Time axis maximum in seconds |
Reference |
Reference event. |
Distance |
An option to draw linear or inverted distance |
Summary of Numerical Results
The following information is available in the Summary of Numerical Results
Column |
Description |
|---|---|
Variable |
Variable name. |
YMin |
Y axis minimum. |
YMax |
Y axis maximum. |
Spikes |
The number of spikes used in calculation |
Mean Freq. |
Mean firing rate. |
Algorithm
For each spike that occurred at time t[i], this graph shows the distance from this spike to the closest spike (timestamp) in the reference event:
dist = min(abs(t[i] - ref[j])),
where ref[j] is a timestamp of the reference event
If Distance is Linear, the vertical line is drawn
from point (t[i], 0.) to point (t[i], dist).
If Distance is Inverted, the vertical line is drawn
from point (t[i], 0.) to point (t[i], 1/dist).