Find Oscillations
This analysis identifies episodes of oscillatory activity in the specified frequency band in recorded analog signals.
Parameters
Parameter |
Description |
|---|---|
XMin (sec) |
Analysis is run on the data from a specific time range [XMin, XMax]. XMin specifies time range minimum in seconds. |
XMax (sec) |
Analysis is run on the data from a specific time range [XMin, XMax]. XMax specifies time range maximum in seconds. |
Window Width (sec) |
Frequency power ratios are calculated in consecutive time windows. This parameter specifies the width of each window in seconds. |
Use Custom Window Shift |
By default (if Use Custom Window Shift is not checked), window shift is equal to Window Width (sec) (so the analysis is done over consecutive non-overlapping windows). If Use Custom Window Shift option is selected, the shift is specified by Window Shift (sec) parameter. |
Window Shift (sec) |
If Use Custom Window Shift is not checked, window shift is equal to Window Width (sec) and this parameter is ignored. If Use Custom Window Shift option is selected, the shift is specified by Window Shift (sec) parameter. |
Main Band Min Freq (Hz) |
Specifies minimum of the main frequency band in Hz (for example, 3 Hz for theta band). |
Main Band Max Freq (Hz) |
Specifies maximum of the main frequency band in Hz (for example, 6 Hz for theta band). |
Method |
Specifies what method to use to identify periods with oscillations. There are two method options: Use Ratio to Other Band or Use Percent of Main Band. |
Second Band Min Freq (Hz) |
Specifies minimum of the second frequency band in Hz (for example, 2 Hz for delta band). If Method is Use Percent of Main Band, this parameter is ignored. |
Second Band Max Freq (Hz) |
Specifies maximum of the second frequency band in Hz (for example, 3 Hz for delta band). If Method is Use Percent of Main Band, this parameter is ignored. |
Min Power Ratio |
Ratio of the power of the main frequency to the power of the second frequency must exceed this value. If Method is Use Percent of Main Band, this parameter is ignored. |
Min Percent |
Percent of spectrum energy of the main band must exceed this value. If Method is Use Ratio to Other Band, this parameter is ignored. |
Min Number of Windows |
If Method is Use Ratio to Other Band, the Ratio must exceed Min Power Ratio in a number of consecutive windows. This parameter specifies minimum number of consecutive windows. If Method is Use Percent of Main Band, the Percent of spectrum energy of the main band must exceed Min Percent in a number of consecutive windows. This parameter specifies minimum number of consecutive windows. |
Filter Type |
The type of the frequency filter. |
Filter Order |
The order of the FIR frequency filter. The order should be 4 or higher. If FIR filter order is odd, order+1 is used. |
IIR Filter Order |
The order of the IIR Butterworth frequency filter. 2 is recommended. |
Result Prefix |
The prefix for generating names of the results. For example, if we analyze variable LFP and the prefix is Theta, the results will have names LFP_Theta_Epochs, LFP_Theta_Filtered and LFP_Theta_ZeroPhase. |
Send to Matlab |
An option to send the matrix of numerical results to Matlab. See also Matlab Options. |
Matrix Name |
Specifies the name of the results matrix in Matlab workspace. |
Matlab command |
Specifies a Matlab command that is executed after the numerical results are sent to Matlab. |
Send to Excel |
An option to send numerical results or summary of numerical results to Excel. See also Excel Options. |
Sheet Name |
The name of the worksheet in Excel where to copy the numerical results. |
TopLeft |
Specifies the Excel cell where the results are copied. Should be in the form CR where C is Excel column name, R is the row number. For example, A1 is the top-left cell in the worksheet. |
Analysis Results
This analysis adds several new variables to the data file. For example, if we analyze continuous variable LFP and the Result Prefix is Theta, this analysis will add the following new variables to the file:
LFP_Theta_Epochs (interval variable that specifies beginning and end of each oscillatory episode)
LFP_Theta_ZeroPhase (event variable containing timestamps of the starts of the oscillation cycles)
LFP_Theta_Filtered (continuous variable containing band-filtered LFP)
Variables LFP_Theta_ZeroPhase and LFP_Theta_Epochs can then be used in Firing Phase analysis.
Graphical results display the values of energy for each band (red line for the main band energy and green line for the second band energy) as well as the values of power ratio (black line).
Y axis shows the scale for the band energy values. The scale for the power ratio is shown as a vertical line in the upper-right corner of the graph:
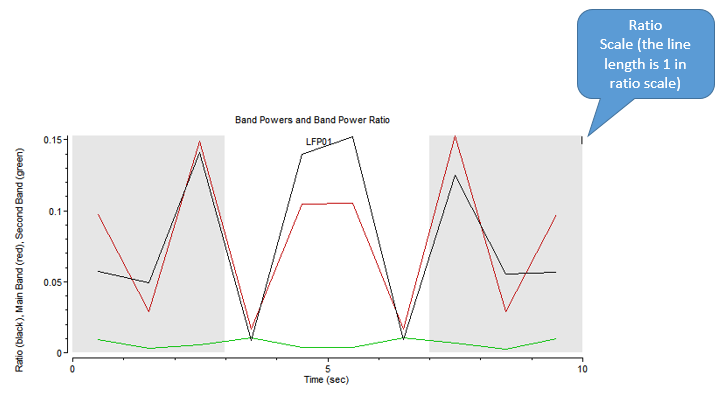
The gray background areas show the identified epochs of oscillatory activity.
Algorithm
For each window, the spectrum of the signal in this window is calculated.
If Method is Use Ratio to Other Band:
The power of each band is calculated as an average spectrum value for the frequencies in the band.
If Min Power Ratio is 4 and Min Number of Windows is 3, a ratio greater than 4 in at least 3 consecutive windows is identified as a start of an oscillatory epoch. The subsequent windows are added to the epoch if the band power ratio for each window is greater than 4.
If Method is Use Percent of Main Band:
The percent or spectrum values in the Main Band is calculated.
If Min Percent is 2 and Min Number of Windows is 3, a percent of main band greater than 2 in at least 3 consecutive windows is identified as a start of an oscillatory epoch. The subsequent windows are added to the epoch if the percent of the main band for each window is greater than 2.
After the oscillatory epochs are identified, the continuous variable is band-filtered within these epochs (with filter band specified as [Main Band Min Freq, Main Band Max Freq]). Hilbert transform is then applied to the filtered signal. The jumps of the phase of the Hilbert transform from 360 degrees to zero are identified as starts of the oscillation cycles.
References
Klausberger et al. Brain-state- and cell-type-specific firing of hippocampal interneurons in vivo. Nature. 2003 Feb 20;421(6925):844-8