Population Vectors
Population vectors in NeuroExplorer can be used to display the linear combinations of histograms in some of the analyses. For example, you can calculate perievent histograms for each individual neuron recorded in a data file. If you want to calculate the response of the whole population of neurons (that is, create an average PST histogram) you need to use a population vector.
Population vector assigns a weight to each spike train or event variable in the file. You can then use population vectors in the following analyses:
Rate Histograms
Interspike Interval Histograms
Perievent Histograms
Trial Counts
If you select the population vector for analysis and then run one of the four analyses listed above, the histogram corresponding to the population vector will be calculated as:
histogram_of_neuron_1 * weight_1 + histogram_of_neuron_2 * weight_2...
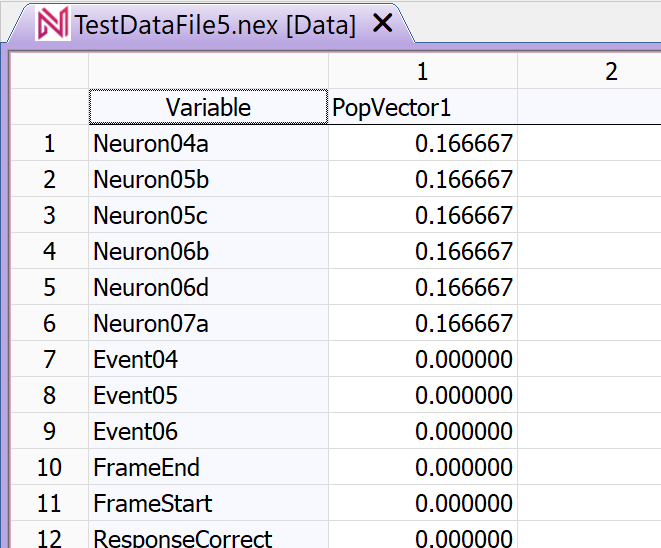
where the weights are defined in the population vector. For example, to calculate an average histogram for 6 neurons, the following population vector should be used:
Creating Population Vectors
You can create new population vectors in NeuroExplorer using Edit | Add Population Vector menu command.
Note
Principal Component Analysis creates a set of population vectors based on the covariances between activities of individual neurons.